Renewable resources: energy storage in offshore applications

Renewable resources: energy storage in offshore applications

Renewable resources are becoming increasingly popular, onshore as well as in large offshore systems. However, there is one considerable problem that is currently restricting the growth of the market: all energy that is being produced, be it by harnessing the power of the sea,  the sun or of the wind, has to be deployed immediately. Any surplus which cannot be used instantly is irrevocably wasted. Moreover, renewable sources tend to be unstable in that natural conditions may change suddenly, which directly affects the output power. The solution to this issue is obvious: to invent a way of storing energy for later usage. 

Dual chamber technology allows independent energy storage

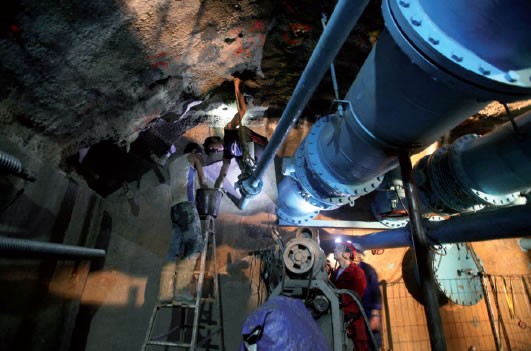
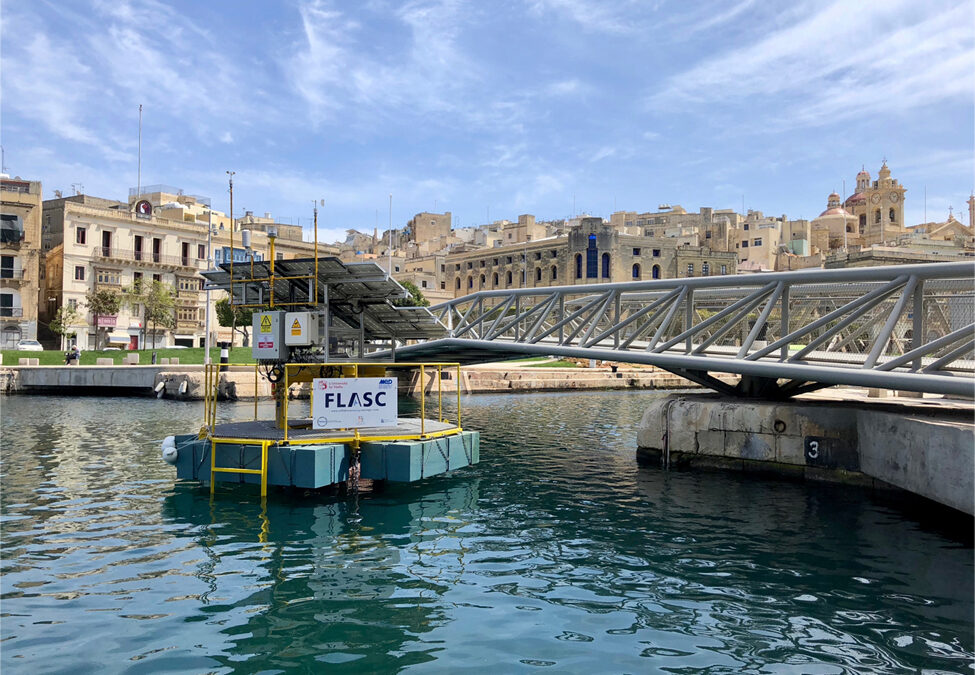
With their project FLASC, engineers from the Faculty of Engineering at the University of Malta have found a way to do so. They have developed a procedure for offshore systems that allows surplus energy to be effectively stored. Compressed air is used for energy storage. Similar solutions that are already in use rely on hydrostatic pressure, which in turn is dependent on water depth. In contrast, the FLASC dual chamber technology allows for an independent pressure range, no matter the depth of water. That way, surplus energy can be securely stored and released at specified intervals that can be set individually. This ensures that changes in the natural environment do no longer directly affect the output power.

Exact measurement with STS ATM/N/T sensors

The whole technology relies on stable air pressure which has to be guaranteed at all times. For this, FLASC uses high quality STS ATM/N/T sensors. The sensitive sensors measure air pressure and temperature at three different spots in the system. With housing material made of resistant titanium, the sensors are perfectly equipped for permanent usage in salt water. Thanks to the integrated temperature sensing element PT100, they are able to cover a temperature measuring range from 5 to 80°C.  All collected data is transferred to the SCADA system, where it can be monitored in real-time.

Polluted sites: Groundwater decontamination requires robust level sensors

Polluted sites: Groundwater decontamination requires robust level sensors

Whether it be old landfills, coal tips, former military sites or refineries, what remains behind is contaminated ground, which is a danger to both humans and the environment. In the rehabilitation of these sites, level sensors are required which are resistant to the often aggressive hazardous substances encountered.

Contaminated sites are not only characterized by adverse health or environmental changes in the soil. In the absence of safety measures (as in old landfills) and depending on soil conditions, hazardous substances are flushed by rain into the groundwater. Depending on the type of usage, a number of different hazardous substances can be found, including, among others:

  • Heavy-metal compounds: Copper, lead, chromium, nickel, zinc and arsenic (a metalloid)
  • Organic materials: Phenols, mineral oil, benzenes, chlorinated hydrocarbons (CHC), aromatic hydrocarbons (PAH)
  • Salts: Chlorides, sulfates, carbonates

Decontamination of the groundwater supply

In the rehabilitation of contaminated sites, not only is cleansing of the soil of great importance, but also the control and purification of the groundwater. Without reliable level sensors that can withstand the adverse conditions, this would not be possible.

The decontamination process usually proceeds as follows: The contaminated groundwater is pumped to the surface and then treated. As filtered flush water, it is next returned to the source of contamination. To prevent this flush water from flowing to a margin away from the contamination source, active hydraulic methods are used for protective infiltration. Water is injected into the ground via several wells situated around the actual decontamination process. The pressure conditions arising here to some extent form a barrier wall and cause the flush water to flow towards the source of contamination. For controlling and monitoring this process, level sensors will be required.

Figure 1: Flow of a decontamination process

Level sensors are of course also used after the remediation work. Long after completion of this work, the affected sites will be monitored to check for any noticeable changes in the water level or the direction of flow.

Level sensors are also used when actively running applications potentially damaging to the environment. Newer landfills are now built like an impermeable basin. The groundwater level below the landfill is lowered, so that no water can flow into adjacent areas in the event of leakage. Here also, the respective water levels are to be monitored by level sensors.

Level sensors in contaminated waters: Highest demands 

Operators in the field of decontamination of polluted sites should be very careful in choosing suitable level sensors. Due to the large number of substances that can be dissolved in the water, there is no single solution that works reliably in every instance. There are several aspects to consider, which we next briefly outline.

Materials

Housing

In most applications, a high-quality stainless steel, as used by STS, is sufficient to protect the measuring cell from aggressive substances. If this were to come in contact with saltwater, then a titanium housing would be chosen, but where galvanic effects are to be expected, a level sensor made of PVDF should be the selection.

Figure 2: ATM/NC chemically resistant level sensor with PVDF housing

Probe cable

Far more critical than choosing a suitable housing, in our experience, is the choice of probe cable. Because of gradual diffusion processes, the progress of destruction is not immediately apparent. Often, this is not visible from the outside even when already damaged. Special caution is therefore required when consulting resistance tables, since these usually say little in particular about probe cables. In the middle of a probe cable is a small air tube, which serves for relative pressure equalization. If the cable material is not one hundred percent resistant, however, raw materials may diffuse through the cable sheath and travel across the air tube into the sensor chip.

Depending upon the substances anticipated, STS users can resort to PE, PUR or FEP cables. The latter can also be used at very high temperatures of up to 110 °C.

Installation

Cable routing

Old landfills and industrial sites are harsh environments, where not only hazardous substances can impair the functionality of the level sensors used. Care must be taken that the cable sheath is not damaged by mechanical burdens (such as debris). Chafing and kinking points should also be avoided. It is therefore recommended to use special protective tubes, such as those offered by STS, when routing cables.

Strain relief

The compression rating of level sensors varies from manufacturer to manufacturer. At STS, all level sensors are pressure-resistant up to 250 meters as standard and their cable is designed for normal tensile strains up to this depth. Nevertheless, operators should consider the use of strain relief in difficult installation conditions.

Mounting

If the sensor is used in flowing waters or tanks with agitators, it can be supplied either with a G 1/2” thread at the cable outlet (pipe mounting) or with a compression fitting (15 mm).

Explosion protection

In applications where a number of hazardous substances are to be expected, it is imperative to also pay attention to explosion protection. Information about this is given by the international standards-compliant ATEX directive.

Correcting Water Level Data for Barometric Pressure Fluctuations

Correcting Water Level Data for Barometric Pressure Fluctuations

Piezometric surveys of Otavi karst aquifer – data analysis through barometric efficiency calculation

The main concepts for identifying and removing barometric pressure effects in confined and unconfined aquifers are described. Although it is commonly known that barometric pressure changes can effect water level readings, few articles and procedures are provided to correctly manage piezometric data.

Knowing the barometric efficiency reduces errors in calculating piezometric surfaces and drawdowns in the piezometers during pumping tests. Stallman (1967) suggested furthermore, that air movement through the unsaturated zone and the attendant pressure lag, could help to better describe the aquifer properties. Rasmussen and Crawford (1997) described how barometric efficiency varies with time in some aquifers and how to calculate the corresponding barometric response function (BRF). They also showed that this last parameter is related to the degree of aquifer confinement.  Finally we present an application of the procedure in an unconfined karst aquifer located in northern Namibia (Otavi mountainland) where a set of four absolute transducers have recorded water level changes and earth tides during a 10 months period at 1 hr. interval.

General framework

The area under investigation is in the SE part of a 6000 sq. km plateau with average elevation of 1300-1500 m a.s.l. and hills reaching 2000 m (see below).

Rock formations are made of thick dolomitic limestone beds with stromatolites (500 b.p.). The strata have been folded into a number of synclines and anticlines generally striking east – west. The southern part of the study area is bordered by a long fault with various mineral occurrences (copper, vanadium, lead, zinc).  Due to the high fracturing, low vegetation cover and lack of soil, surficial runoff is almost nil. Two natural water basins, collapsed dolines, of 100-200 m in large, are located farther north and outside the project area. The mean annual rainfall is 540 mm (1926 – 1992) with peaks during summer, between December and March. Since mid ‘70s and until the year 2000 the area suffered a fall in precipitation that, together with mining activity (Kombat, Tsumeb, Abenab) were responsible for the lowering of the water table of as far as 20-30 m in some places.

From 2005 on, this trend has reversed due to the reduced activity of  the mines and a new meteorological regime.

Hydrogeological framework

This region is well known for its karst features, and hosts some wide underground lakes located between 70 and 120 m below ground surface.

The area is also classified as one of the most important aquifer of the country (Dept. of Water Affairs, MAWRD, area E-F). To glean more valuable insights into this particular environment and locate alternative positions for water boreholes we prepared two piezometric maps (2007-2010) and installed 4 water level transducers in some water points at 2-4 km distance in Harasib farm (fig. 13).

Fig. 13 Piezometric map (February 2007) and position of three water level loggers

The 2007 piezometric surface shows a recharge area, coincident with the topographic highs and feeded by rain infiltration. From this point, underground flow directions are to SW and SE. During this stage we focused our researches to define: 

  • Type of aquifer
  • Aquifer connections between Harasib and Dragon’s lakes
  • Recharge

Chemical analysis of surface and deep waters were conducted in 2007, while continuous barometric pressure and water level readings were made during a ten months period, between September 2010 and June 2011. The aquifer recharge starts when cumulative rain exceeds 400-500 mm. The thickness of the unsaturated part ranges from 40 to 100 m. Considering this value close to the average annual rainfall, and that the aquifer is karstic and highly fractured, one should note that one or two years of scarce precipitation is enough to decrease dramatically the exploitable yield.

Barometric efficiency (BE) and barometric response function (BRF)

Fig. 16 Values of dry period (September – January)

The water level readings have been analysed with the software BETCO (Sandia National Laboratories), to remove the effects of the barometric pressure changes. The measured and corrected values are depicted in fig. 16 and refer to the dry period (September – January) while fig. 17 shows the barometric pressure versus water level changes, used for the calculation of the barometric efficiency.

Fig. 17 Difference in barometric pressure and water levels during the dry period (Sept.-Dec. 2010)

In all examples we notice that:

  • There is a good correlation between measured and corrected values, even if with lower amplitude
  • There still is a variation diminishing in the corrected values; being excluded skin effects phenomena this behaviour could be ascribed to other non-barometric effects (earth tides, double porosity)
  • The initial barometric efficiency values are quite similar (0.55 – 0.61)

In fig. 18 is depicted the barometric response function (BRF) that characterises the water level response over time to a step change in barometric pressure; essentially BRF is a function of time since the imposed load.

Fig. 18 Barometric Response Functions for the three water points. The curves are similar (especially Dragon’s Breath and Harasib lake) suggesting an unconfined aquifer with perhaps a double porosity component.

A good agreement is observed for all three water points. In Dragon’s Breath lake e.g, there is a quick rise to 0.5 and a longer term decay to a lower value (0.2 – 0.3 after 20 hrs), due to the slow passage of air through fractures. The balance between external pressure and the aquifer is reached at 0.1 value.

The shape of the three curves indicate an unconfined aquifer with good hydraulic connections especially between Dragon’s Breath and Harasib lake, this last one at 2 km distance.

The correlation has also been proved by isotopic and chemical analysis made in 2007 (prof. Franco Cucchi, Dept. of  Geology, Trieste University).

Generally speaking the collected data confirm the unconfined behaviour of the aquifer, overlaid by a thick and rigid unsaturated layer, well fractured and hydraulically connected. The initial barometric efficiency is higher than the final.

Earth tides and sensor readings

Fig. 19 Water levels asl in the underground lake. The enlargement above shows small cyclic differences due to earth tides.

Regarding this last topic, data collected are still scarce but we think it is nevertheless interesting to illustrate some thoughts. When inspected in detail the curves show a distinctive zig-zag pattern with peaks every 10-12 hrs (fig. 19). This behaviour supports the effect of earth tides, producing slight changes in the volume of the fractures and pores and hence in the groundwater potential. The Fourier analysis (Shumway, 1988) shows the harmonic structure for the three water points in fig. 20 and the tide components in fig. 21.

Fig. 20  Harmonic structure for the three water points 

Fig. 21  Tidal magnitudes for the main harmonic components (values in ft)

The area close  to Harasib lake has the higher values for the M2 component and this can be considered as an indication of a higher transmissivity zone (Merritt, 2004). This fact is partly confirmed by the presence of a local fracture elongated ENE-WSW very close to Harasib lake.

Concluding remarks

Water levels fluctuations in aquifers are not only due to recharge variations. Barometric pressure and tides are among the main concerns. Knowing barometric pressure variation for a particular site, helps to validate a piezometric map or a pumping test. Modern pressure transducers vented to the atmosphere are recognised to be extremely useful when installed into boreholes. Recordings are different following the type of aquifer and the graphs can be diagnostic of the degree of confinement for the monitored levels.

Useful parameters that characterize this behaviour are the barometric efficiency (BE) and the barometric response function (BRF). The latter characterizes a deep unconfined aquifer when values are initially high and approximate 0 on the long term response, conversely the aquifer is confined/semiconfined when values stay constant or approximate 1 on the long term response. Removing barometric effects is sometimes necessary to correctly interpret a pumping test or dress up a piezometric map. Finally a particular analysis of the water level data allows to calculate the harmonic components due to tides and hence some hydrogeological features.

This theoretical approach has been applied to the data gathered for a project study of an unconfined karst aquifer in northern Namibia. Water levels have been monitored during a 10 months period, with hourly readings and by means of four transducers. The data confirmed the general assumptions obtained during preceding investigations and have underlined the importance of the use of such instruments for aquifer assessment, showing particularly:

  1. The role of the recharge due to rainfall and high transmissivity around Harasib lake area
  2. The good hydraulic connection and conductivity for the aquifer
  3. The lack of confining layers (it’s a deep and rigid unconfined aquifer)
  4. The storage effect of the unsaturated part, above the water table, that starts draining when rain exceeds 400/500 mm
  5. The other pressure effects, such earth tides, can be highlighted using water level transducers

Acknowledgements

Namgrows stands for Namibian Groundwater Systems, a project set up by the author and the colleague Gérald Favre, with the participation of geologists and cavers from 4 different countries (Italy, Switzerland, Namibia, South Africa). The project was supported in Namibia by eng. Sarel La Cante and his wife Leoni Pretorius (Harasib farm).

The company STS – Italia sponsored us by providing the water level sensors and its technical support.

I also wish to thank prof. Todd Rasmussen (The University of Georgia, Athens)  for providing his valuable insights into the data and particularly those regarding the barometric efficiency and earth tides.

 Source: Dr. Alessio Fileccia / Consulting Geologist

Level loggers monitoring water levels in Venice

Level loggers monitoring water levels in Venice

The Piazza San Marco will never flood: Level data loggers from STS are in use to continuously measure groundwater levels at the Piazza San Marco. These are particularly robust and are also suited for application in various scenarios.

In 2003, the company of S.P.G. began to install several groundwater dataloggers at the Piazza San Marco in Venice. These were designed for the specific demands and possess, above all, the attribute of withstanding several days submerged in saline waters, since on rising tides, Piazza San Marco is regularly flooded. The site operates in conjunction with efforts initiated by the water regulatory authority for protecting the lagoons and the city of Venice from flooding.

The appointed consortium of Venezia Nuova earmarked the wharfage opposite the Piazza San Marco with innovative technical features. The challenge consisted of monitoring the flow of groundwater, which was by degrees shifting from the site area to the buildings located behind. At the client’s request, level data loggers from STS were installed to continuously measure the fluctuations in groundwater levels.

The groundwater datalogger permits a simultaneous measurement of level, temperature and conductivity in ranges of 0…50 cmWS to 0…250 mWC, -5 to 50 °C and 0.020…20 mS/cm. When required, the end user can at any time retrofit a data transmission unit. The logger features a simple, user-friendly operation, an extended measurement memory for up to 1.5 million readings and a probe diameter of only 24 mm or 10 mm.

The plug-in units also allow for the possibility of cable extension. New software functions can also be updated without their requiring inconvenient return through the end user. The standard lithium batteries can be changed on site in no time. Data can be transferred in ASCII or XML format and further processed using standard software such as Excel. Variable data-saving intervals dependent on pressure or time allow for versatile measurements.

Through the use of various materials including stainless steel, titanium, PUR, PE or Teflon cable, a high medium tolerance is attained for the most varied of applications, such as landfills, contaminated sites, pump trials, high-water alarms and discharge/overflow logging in rain overflow basins.

Original publication: Konstruktion magazine

Water in spite of drought

Water in spite of drought

Water management experts at the Karlsruhe Institute of Technology (KIT) have constructed a subterranean dam with an integrated hydroelectric plant inside a karst cavern on the Indonesian island of Java. The power station located 100m below ground now provides plentiful water from the cavern during the dry season. Two data loggers installed there measure the water levels both in front of and behind the dam wall. The level of the upper water reaches 15 – 20m, while the lower level, where water discharges again from the turbine, attains a maximum of 2m.

The karst area of Gunung Kidul on the south coast of Java is one of the poorest regions in Indonesia. The ground is too barren for a bountiful supply and in the dry season the flowing waters actually run dry. Water from the rainy season peters out quite quickly, but does collect within an underground cave system. This natural water reservoir has now been harnessed with a cave power station. The fact that even in the dry season over 1,000 liters of water per second flows through the Bribin Cave speaks for the ideal location of this dam. Instead of complex turbines, the mechanical energy to drive the feed pumps is generated by reverse-driven circulation pumps. The five parallel-operating feed pumps are thus highly cost-effective, incurring only minor operating and maintenance costs. The supply pumps send part of the water 220m high to a lake named Kaligoro Reservoir situated upon a mountain. The key stumbling block to this project was successfully overcome during the test damming phase. The cave did effectively hold the water and a crucial dam height of 15m was indeed achieved.

In March 2010, the installation was then handed over to the Indonesian authorities. It can now provide 80,000 people with up to 70 liters of water per day. Previously, the populace had only 5 – 10 liters available per day during the dry season, for personal hygiene, household and livestock purposes. Incidentally, each German uses on average 120 liters per day, for comparison.

Function of the pressure data loggers

The pressure loggers measure the water levels in front of and behind the dam wall. The normal level amounts to 15m, but it can reach up to 20m during heavy rainfall. The other probes measure the water level whilst submerged, in particular where water discharges from the turbine. Levels of up to 2m are recorded in this area. The pressure loggers from STS were chosen due to their high overload capacity of 3x their full-scale range, the low characteristics deviation of maximal 0.1% and an enhanced long-term stability of between 0.1 % und 0.5 % FS per annum.

These level loggers cover pressure ranges between 0 – 100 mbar and 0 – 600 bar, thus permitting level measurements in the ranges of 0 – 100 cmAq to 0 – 6,000 mAq. The measurement interval itself is variable between 0.5s and 24h. The units are further distinguished by a measurement data memory of up to 1.5 million measured values and a narrow probe diameter. Additionally, their standard lithium batteries can be swapped out on site in no time at all.

Variable data-saving intervals dependent upon pressure or time permit for flexible measurements. With the use of various materials like stainless steel, titanium, PUR, PE or Teflon cable, a high medium tolerance is achieved, allowing for the most varied of applications. Besides the level recordings of groundwater, wells, boreholes, lakes and rivers, these level loggers are also suited to leak testing in gas, water and other pipeline projects, as well as pipeline analysis and pressure testing in gas, water and community heating pipeline networks. They have also proven themselves optimally in gas pressure control stations and in the verification of a constant supply pressure.

Sources: Karlsruhe Institute of Technology (KIT) – Institute for Water and River Basin Management (IWG)

The force of water: Renewable energy from the seas

The force of water: Renewable energy from the seas

The idea of harnessing the force of the seas for energy generation is not a new one. The main challenge lies in developing efficient energy conversion systems that keep costs low whilst barely impacting the environment. A highly promising project termed REWEC3 has emerged in this regard in Italy.

The Resonant Wave Energy Converter (REWEC3) is an advanced technology that produces electrical power from the energy of the sea’s waves. The first instance of this type has been successfully constructed at the port of Civitavecchia. Its functional principle is based on Oscillating Water Column (OWC) systems.

OWCs exhibit great potential as a renewable energy source of low environmental impact. When water levels around and within an OWC rise, air is displaced inside a collecting chamber by this water motion and then driven back and forth through a Power-Take-Off (PTO) system. The PTO system in turn converts this air movement into energy. Amongst the models that convert air motion into electricity, the PTO system takes the form of a bidirectional turbine. This ensures that, regardless of airflow orientation, the turbine always rotates in the same direction, thus providing for continuous energy.

The REWEC3 system in Civitavecchia arose from a research project at the Mediterranea University of Reggio Calabria and is operated today by the Wavenergy.it enterprise. The installation essentially consists of a reinforced caisson made of concrete. This caisson has a vertical shaft on its wave-facing side (1), which, through an opening (2) to the sea, on the one side, as well as by a deeper-sitting opening (4), is connected to an inner chamber (3) on the other side. This inner chamber contains water in its lower section (3a) and an air pocket within its upper reaches (3b). An air duct (5) connects this air pocket to the ambient air through a self-rectifying turbine (6). Wave movements create pressure changes at the entrance to the vertical shaft (2). The water inside the shaft thus rises and falls within the shaft interior (1). In this way, the air pocket in the shaft’s upper section compresses or expands. Airflows within the air duct (5) then drive the self-rectifying turbine (6).

The principle of REWEC3 installations thus exploits wave movements in the sea for power generation. The air within the air chamber is alternately compressed (by wave peaks) and decompressed (by wave troughs) so that an alternating airflow is created inside a duct which in turn drives a self-rectifying turbine. The electrical energy is subsequently produced by a coaxial generator.

The advantages of REWEC3 installations in power generation speak for themselves:

  • They do not impinge visually upon the landscape, since they are barely detectable from the outside.
  • They absorb the effects of waves and moderate the impact of storms on the coastline.
  • Marine fauna are not endangered due to the elevated position of the turbines.
  • An installation of one kilometer in length can produce 8,000 MWh annually.

A system such as the REWEC3 obviously requires a reliable and rapid monitoring of pressure differences arising from impacting waves. Following extensive tests, the researchers at the Mediterranea University opted for the highly precise  ATM.1ST/N level sensors from STS. Crucial to this decision in favor of ATM.1ST/N pressure transmitters were the very short response times of < 1ms / 10 … 90% FS, as well as their very good long-term stability across a wide temperature range. Additionally, the fact that measuring instruments from STS, thanks to their modular construction, can be easily adapted to various requirements also spoke loudly. The ATM.1ST/N level sensors deployed can even be readily configured for use with the data loggers from National Instruments.

Image Source: Wavenergy.it

Subscribe To Our Newsletter

Join our mailing list to receive the latest news and updates from our team.

You have Successfully Subscribed!