Deprecated: Hook wp_smush_should_skip_parse is deprecated since version 3.16.1! Use wp_smush_should_skip_lazy_load instead. in /home/xepoxenu/www/new.stssensors.com/wp-includes/functions.php on line 6078
Hydrostatic Pressure Measurement Archives - Page 2 of 3 - STS Switzerland (EN)
Deprecated: Hook wp_smush_should_skip_parse is deprecated since version 3.16.1! Use wp_smush_should_skip_lazy_load instead. in /home/xepoxenu/www/new.stssensors.com/wp-includes/functions.php on line 6078
Reliable groundwater and surface water monitoring in Romania

Reliable groundwater and surface water monitoring in Romania

A seamless control system with alarm function is required to perform precise water level measurements and to make reliable forecasts on potable water supply, as well as to anticipate floods. Together with its partner MDS Electric Srl, STS has implemented a comprehensive system for groundwater and surface water management in Romania.

Romania draws a major part of its potable water from surface waters such as the Danube, as well as from groundwater resources. A sound management of these natural resources is therefore of huge importance.

To safeguard potable water supply and to protect from flooding, the nation has invested in a comprehensive hydrological measurement infrastructure.

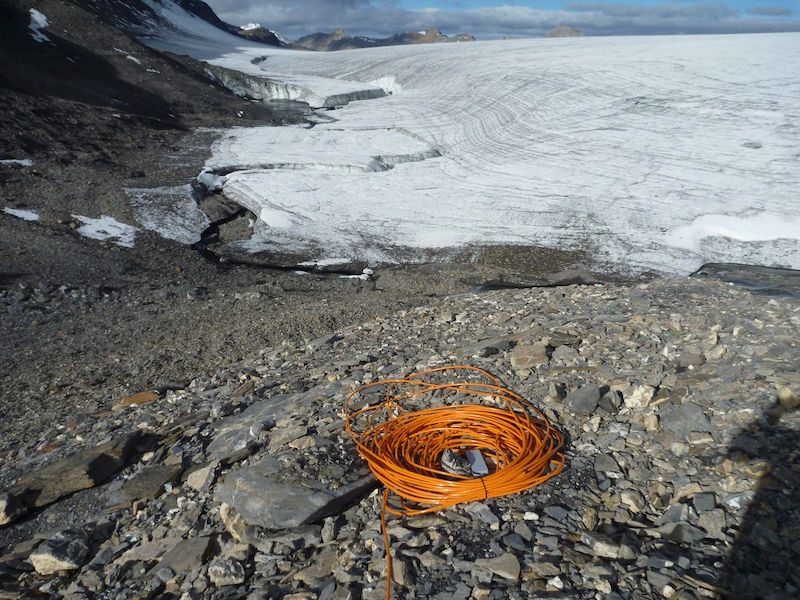
Figure 1: Groundwater measurement point 

In collaboration with its Romanian partner, MDS Electric Srl, over 700 data loggers and more than 350 data transmission systems have thus been installed throughout the country in recent years – also including remote areas. For this reason, the primary investment was in battery-operated measuring instruments, which monitor the current situation on the rivers of the Danube region and also the groundwater resources across the country.

Requirements-specific measurement solutions 

This was a complex undertaking, since each of the submersible probes and data transmission systems deployed required a different assessment and intervention to comply with their respective conditions. An automatic alarm function was also indispensable in this case, should predefined limit values be exceeded.

The permanent monitoring of water levels at important nodes across the potable water supply, as well as the rivers of the Danube region, hinges upon a multitude of requirements:

  • An automated and dependable data transfer via M2M protocol
  • Automatic alarm function when limit value is exceeded
  • Monitoring of water level and temperature, as well as ambient temperature in some instances
  • A server solution with functions for visualizing, evaluating and processing the measured data, as well as the integrated database
  • Easy installation and maintenance
  • On-site support service

For the implementation of this large-scale project, STS opted in pressure and temperature measurements for the DL/N 70 and WMS/GPRS/R/SDI-12 data loggers, or – depending upon requirement – the DTM.OCS.S/N digital data transmitter with Modbus interface to ensure highly precise water level measurement to a 0.03 percent accuracy at critical points.

In association with our local partner MDS Electric Srl, STS was able to realize the entire water level monitoring system from a single source. Each installation point was evaluated on-site by experts from MDS Electric Srl and STS, in order to install a custom solution at each of those individual measurement points. The long-term stability of the pressure measurement technology deployed is also guaranteed. The Modbus transmitter DTM.OCS.S/N excels in this area with an excellent long-term stability of less than 0.1 percent total error per annum. Because of its low energy consumption and robust design, this sensor performs largely maintenance-free for years on end.

Further advantages of the DTM.OCS.S/N in brief:

  • Pressure range: 200mbar…25bar
  • Accuracy: ≤ ± 0.15 / 0.05 / 0.03 % FS
  • Operating temperature: -40… 85 °C
  • Media temperature: -5…80 °C
  • Interface: RS485 with Modbus RTU (standard protocol)
  • Simple implementation in existing Modbus systems
  • Easy adjustment of span and offset
Predicting natural hazards: Level measurement of glacial lakes

Predicting natural hazards: Level measurement of glacial lakes

The glaciers of the Alps are in constant flux. After thawing in the spring and summer, lakes can appear whose levels have to be continuously monitored to detect floods at an early stage. Dependable pressure sensors, level sensors und data loggers are in need here.

The internationally active Swiss company Geopraevent develops, installs and operates high-grade alarm and monitoring systems for various natural hazards, including avalanches, landslides and floods. According to the task and local conditions, the systems are individually designed and implemented. At present, more than 60 alarm and monitoring systems are in use worldwide. When it comes to natural catastrophes, there is no room for error in light of the potentially serious consequences: The technology employed must perform solidly over the years. For this reason, every system is connected to Geopraevent servers to ensure fault-free operation.

Level measurement at the Plaine Morte glacial lakes

This also applies to the system commissioned in 2011 for monitoring the Plaine Morte glacier in the Bernese Alps. As soon as temperatures rise in spring, the glacier begins to melt (see video). From this melting water, three lakes (the Faverges, Vatseret and Strubel) form each year, which then swell constantly over the summer months before finally emptying again.

Danger to the nearby municipality of Lenk, which commissioned the project, arises mainly from the Faverges lake. Like the other two lakes, it exists only in the warmer seasons. After its annual recurrence as a result of snow and glacier melt, the water warms up in the months that follow and then seeks an outflow through the ice. Little by little, this outflow channel becomes further thawed away, meaning that the flow rate constantly increases. In August 2014, for example, some 20 cubic meters of water per second swept down the Trüebach in the direction of Lenk. After emptying of the glacier lake, the cycle will then begin anew the next spring with the onset of the thaw.

To predict a glacial lake breakout and initiate appropriate protective measures, a monitoring system was installed by Geopraevent which ensures an early warning period of one to two days. In the realization of this project, due to outstanding properties of long-term stability and others, STS sensor technology has also been relied upon.

Glacial lake outbreak alarm by SMS

To be able to realistically estimate the danger posed by these glacial lakes at all times, a total of four measuring stations were set up: One each on the three lakes, as well as one on the Trüebach, down which the water flows towards the municipality of Lenk during a glacier lake discharge.

The water level of the three glacial lakes is monitored by means of pressure sensors. To this end, the measuring instruments are submerged into the deepest part of each lake by a helicopter. The level sensors ATM/N/T are connected via a cable to data loggers mounted on a ridge. The data loggers used in this case are solar powered and their collected data is transferred to Geopraevent via mobile telephony. Should the data logger convey dropping levels, this is a clear sign of emptying in the corresponding glacial lake.

Measuring station at the Plaine Morte glacier (Photo: Geopraevent)

Besides lake-level measurement, a level radar also monitors the fill level of the Trüebach. This additional measuring station serves to verify that the glacier lake is also actually emptying out towards the municipality itself. Since the Trüebach passes through a ravine, the level radar is attached to a steel cable stretched across the ravine and is also connected to a datalogger via a cable.

As soon as the pre-defined limit values are undershot or exceeded in the lakes and the Trüebach, those responsible in the community of Lenk are informed automatically by SMS and can then take appropriate measures to prevent flooding.

Better defense against climatic anomalies using dependable level sensors

Better defense against climatic anomalies using dependable level sensors

Over the past few years, Russia has been increasingly struggling with environmental disasters caused by extreme weather conditions. This has not only led to massive material damage, but has also cost human lives. An extensive structural program for better weather forecasting is now destined to diminish those risks and also to support research on climate change.

Weather anomalies, such as the extensive drought of 2010 or the heavy flooding in the Amur region in 2013, generated major attention and concern within Russia, as well as beyond. The Federal Service for Hydrometeorology and Environmental Monitoring (Roshydromet) is responsible for high-precision weather forecasts in Russia and is now to be further bolstered under the terms of the Hydrometeorological Services Modernization Project-II. A little over 139 million dollars has been invested for this purpose.

This large-scale modernization project will be supporting Roshydromet in providing the Russian population, as well as municipal authorities, with reliable and up-to-date information on weather, hydrology and climate. At the same time, Russia is also to be better integrated into the global system of meteorological services.

The individual project measures include:

  • Strengthening of information and communication technologies for providing data on weather, climate and hydrology,
  • Modernization of the observation network,
  • Consolidation of institutions,
  • Optimized access to Roshydromet data and information,
  • The improvement of disaster protection.

With the modernization of Roshydromet’s hydrological observation network in the Lena, Jana, Indigirka, Vilui and Kolyma rivers, special attention has been paid to monitoring technology, which, largely maintenance-free, performs reliably in difficult to access areas and also under harsh conditions such as permafrost.

Fig. 1: Overview of the monitoring sites

Some of the water level sensors essential here were provided by STS and, in collaboration with the Russian partner company Poltraf CIS Co. Ltd., installed at 40 hydrological monitoring stations. The project itself comprised the following requirements:

  • The permanent monitoring of water levels and temperatures, as well as the measurement of rainfall and snowfall. This also includes the installation of surveillance cameras to keep the formation of ice at strategically important points in view.
  • The automatic and error-free transmission of data via GPS or satellite.
  • An alarm function when exceeding defined limits.
  • A server solution for storing the collected data, including a software for the visualization, evaluation and processing of that data.
  • A simple-to-install and easy-to-use technology that will perform for years on end without major maintenance.
  • A professional preparation of the actual monitoring locations.

To meet this demanding assignment, the DTM.OCS.S/N/RS485 Modbus sensor, including others, has been employed. These digital level probes actually measure both level and temperature. The harsh conditions are addressed by its robust design and permissible ambient temperatures of -40 to 80 degrees Celsius, whilst an accuracy of ≤ 0.03% FS ensures precise results at critical measuring points.

Some further advantages of this digital level sensor in brief:

  • High-precision digital level sensor for easy integration into standard Modbus networks
  • Individual adaptation to application through modular design
  • Highest precision over the entire temperature range due to electronic compensation
  • Adjustment of zero offset and measurement range via Modbus
  • Extended long-term stability of measuring cell
  • Sensor can be recalibrated

Polluted sites: Groundwater decontamination requires robust level sensors

Polluted sites: Groundwater decontamination requires robust level sensors

Whether it be old landfills, coal tips, former military sites or refineries, what remains behind is contaminated ground, which is a danger to both humans and the environment. In the rehabilitation of these sites, level sensors are required which are resistant to the often aggressive hazardous substances encountered.

Contaminated sites are not only characterized by adverse health or environmental changes in the soil. In the absence of safety measures (as in old landfills) and depending on soil conditions, hazardous substances are flushed by rain into the groundwater. Depending on the type of usage, a number of different hazardous substances can be found, including, among others:

  • Heavy-metal compounds: Copper, lead, chromium, nickel, zinc and arsenic (a metalloid)
  • Organic materials: Phenols, mineral oil, benzenes, chlorinated hydrocarbons (CHC), aromatic hydrocarbons (PAH)
  • Salts: Chlorides, sulfates, carbonates

Decontamination of the groundwater supply

In the rehabilitation of contaminated sites, not only is cleansing of the soil of great importance, but also the control and purification of the groundwater. Without reliable level sensors that can withstand the adverse conditions, this would not be possible.

The decontamination process usually proceeds as follows: The contaminated groundwater is pumped to the surface and then treated. As filtered flush water, it is next returned to the source of contamination. To prevent this flush water from flowing to a margin away from the contamination source, active hydraulic methods are used for protective infiltration. Water is injected into the ground via several wells situated around the actual decontamination process. The pressure conditions arising here to some extent form a barrier wall and cause the flush water to flow towards the source of contamination. For controlling and monitoring this process, level sensors will be required.

Figure 1: Flow of a decontamination process

Level sensors are of course also used after the remediation work. Long after completion of this work, the affected sites will be monitored to check for any noticeable changes in the water level or the direction of flow.

Level sensors are also used when actively running applications potentially damaging to the environment. Newer landfills are now built like an impermeable basin. The groundwater level below the landfill is lowered, so that no water can flow into adjacent areas in the event of leakage. Here also, the respective water levels are to be monitored by level sensors.

Level sensors in contaminated waters: Highest demands 

Operators in the field of decontamination of polluted sites should be very careful in choosing suitable level sensors. Due to the large number of substances that can be dissolved in the water, there is no single solution that works reliably in every instance. There are several aspects to consider, which we next briefly outline.

Materials

Housing

In most applications, a high-quality stainless steel, as used by STS, is sufficient to protect the measuring cell from aggressive substances. If this were to come in contact with saltwater, then a titanium housing would be chosen, but where galvanic effects are to be expected, a level sensor made of PVDF should be the selection.

Figure 2: ATM/NC chemically resistant level sensor with PVDF housing

Probe cable

Far more critical than choosing a suitable housing, in our experience, is the choice of probe cable. Because of gradual diffusion processes, the progress of destruction is not immediately apparent. Often, this is not visible from the outside even when already damaged. Special caution is therefore required when consulting resistance tables, since these usually say little in particular about probe cables. In the middle of a probe cable is a small air tube, which serves for relative pressure equalization. If the cable material is not one hundred percent resistant, however, raw materials may diffuse through the cable sheath and travel across the air tube into the sensor chip.

Depending upon the substances anticipated, STS users can resort to PE, PUR or FEP cables. The latter can also be used at very high temperatures of up to 110 °C.

Installation

Cable routing

Old landfills and industrial sites are harsh environments, where not only hazardous substances can impair the functionality of the level sensors used. Care must be taken that the cable sheath is not damaged by mechanical burdens (such as debris). Chafing and kinking points should also be avoided. It is therefore recommended to use special protective tubes, such as those offered by STS, when routing cables.

Strain relief

The compression rating of level sensors varies from manufacturer to manufacturer. At STS, all level sensors are pressure-resistant up to 250 meters as standard and their cable is designed for normal tensile strains up to this depth. Nevertheless, operators should consider the use of strain relief in difficult installation conditions.

Mounting

If the sensor is used in flowing waters or tanks with agitators, it can be supplied either with a G 1/2” thread at the cable outlet (pipe mounting) or with a compression fitting (15 mm).

Explosion protection

In applications where a number of hazardous substances are to be expected, it is imperative to also pay attention to explosion protection. Information about this is given by the international standards-compliant ATEX directive.

Correcting Water Level Data for Barometric Pressure Fluctuations

Correcting Water Level Data for Barometric Pressure Fluctuations

Piezometric surveys of Otavi karst aquifer – data analysis through barometric efficiency calculation

The main concepts for identifying and removing barometric pressure effects in confined and unconfined aquifers are described. Although it is commonly known that barometric pressure changes can effect water level readings, few articles and procedures are provided to correctly manage piezometric data.

Knowing the barometric efficiency reduces errors in calculating piezometric surfaces and drawdowns in the piezometers during pumping tests. Stallman (1967) suggested furthermore, that air movement through the unsaturated zone and the attendant pressure lag, could help to better describe the aquifer properties. Rasmussen and Crawford (1997) described how barometric efficiency varies with time in some aquifers and how to calculate the corresponding barometric response function (BRF). They also showed that this last parameter is related to the degree of aquifer confinement.  Finally we present an application of the procedure in an unconfined karst aquifer located in northern Namibia (Otavi mountainland) where a set of four absolute transducers have recorded water level changes and earth tides during a 10 months period at 1 hr. interval.

General framework

The area under investigation is in the SE part of a 6000 sq. km plateau with average elevation of 1300-1500 m a.s.l. and hills reaching 2000 m (see below).

Rock formations are made of thick dolomitic limestone beds with stromatolites (500 b.p.). The strata have been folded into a number of synclines and anticlines generally striking east – west. The southern part of the study area is bordered by a long fault with various mineral occurrences (copper, vanadium, lead, zinc).  Due to the high fracturing, low vegetation cover and lack of soil, surficial runoff is almost nil. Two natural water basins, collapsed dolines, of 100-200 m in large, are located farther north and outside the project area. The mean annual rainfall is 540 mm (1926 – 1992) with peaks during summer, between December and March. Since mid ‘70s and until the year 2000 the area suffered a fall in precipitation that, together with mining activity (Kombat, Tsumeb, Abenab) were responsible for the lowering of the water table of as far as 20-30 m in some places.

From 2005 on, this trend has reversed due to the reduced activity of  the mines and a new meteorological regime.

Hydrogeological framework

This region is well known for its karst features, and hosts some wide underground lakes located between 70 and 120 m below ground surface.

The area is also classified as one of the most important aquifer of the country (Dept. of Water Affairs, MAWRD, area E-F). To glean more valuable insights into this particular environment and locate alternative positions for water boreholes we prepared two piezometric maps (2007-2010) and installed 4 water level transducers in some water points at 2-4 km distance in Harasib farm (fig. 13).

Fig. 13 Piezometric map (February 2007) and position of three water level loggers

The 2007 piezometric surface shows a recharge area, coincident with the topographic highs and feeded by rain infiltration. From this point, underground flow directions are to SW and SE. During this stage we focused our researches to define: 

  • Type of aquifer
  • Aquifer connections between Harasib and Dragon’s lakes
  • Recharge

Chemical analysis of surface and deep waters were conducted in 2007, while continuous barometric pressure and water level readings were made during a ten months period, between September 2010 and June 2011. The aquifer recharge starts when cumulative rain exceeds 400-500 mm. The thickness of the unsaturated part ranges from 40 to 100 m. Considering this value close to the average annual rainfall, and that the aquifer is karstic and highly fractured, one should note that one or two years of scarce precipitation is enough to decrease dramatically the exploitable yield.

Barometric efficiency (BE) and barometric response function (BRF)

Fig. 16 Values of dry period (September – January)

The water level readings have been analysed with the software BETCO (Sandia National Laboratories), to remove the effects of the barometric pressure changes. The measured and corrected values are depicted in fig. 16 and refer to the dry period (September – January) while fig. 17 shows the barometric pressure versus water level changes, used for the calculation of the barometric efficiency.

Fig. 17 Difference in barometric pressure and water levels during the dry period (Sept.-Dec. 2010)

In all examples we notice that:

  • There is a good correlation between measured and corrected values, even if with lower amplitude
  • There still is a variation diminishing in the corrected values; being excluded skin effects phenomena this behaviour could be ascribed to other non-barometric effects (earth tides, double porosity)
  • The initial barometric efficiency values are quite similar (0.55 – 0.61)

In fig. 18 is depicted the barometric response function (BRF) that characterises the water level response over time to a step change in barometric pressure; essentially BRF is a function of time since the imposed load.

Fig. 18 Barometric Response Functions for the three water points. The curves are similar (especially Dragon’s Breath and Harasib lake) suggesting an unconfined aquifer with perhaps a double porosity component.

A good agreement is observed for all three water points. In Dragon’s Breath lake e.g, there is a quick rise to 0.5 and a longer term decay to a lower value (0.2 – 0.3 after 20 hrs), due to the slow passage of air through fractures. The balance between external pressure and the aquifer is reached at 0.1 value.

The shape of the three curves indicate an unconfined aquifer with good hydraulic connections especially between Dragon’s Breath and Harasib lake, this last one at 2 km distance.

The correlation has also been proved by isotopic and chemical analysis made in 2007 (prof. Franco Cucchi, Dept. of  Geology, Trieste University).

Generally speaking the collected data confirm the unconfined behaviour of the aquifer, overlaid by a thick and rigid unsaturated layer, well fractured and hydraulically connected. The initial barometric efficiency is higher than the final.

Earth tides and sensor readings

Fig. 19 Water levels asl in the underground lake. The enlargement above shows small cyclic differences due to earth tides.

Regarding this last topic, data collected are still scarce but we think it is nevertheless interesting to illustrate some thoughts. When inspected in detail the curves show a distinctive zig-zag pattern with peaks every 10-12 hrs (fig. 19). This behaviour supports the effect of earth tides, producing slight changes in the volume of the fractures and pores and hence in the groundwater potential. The Fourier analysis (Shumway, 1988) shows the harmonic structure for the three water points in fig. 20 and the tide components in fig. 21.

Fig. 20  Harmonic structure for the three water points 

Fig. 21  Tidal magnitudes for the main harmonic components (values in ft)

The area close  to Harasib lake has the higher values for the M2 component and this can be considered as an indication of a higher transmissivity zone (Merritt, 2004). This fact is partly confirmed by the presence of a local fracture elongated ENE-WSW very close to Harasib lake.

Concluding remarks

Water levels fluctuations in aquifers are not only due to recharge variations. Barometric pressure and tides are among the main concerns. Knowing barometric pressure variation for a particular site, helps to validate a piezometric map or a pumping test. Modern pressure transducers vented to the atmosphere are recognised to be extremely useful when installed into boreholes. Recordings are different following the type of aquifer and the graphs can be diagnostic of the degree of confinement for the monitored levels.

Useful parameters that characterize this behaviour are the barometric efficiency (BE) and the barometric response function (BRF). The latter characterizes a deep unconfined aquifer when values are initially high and approximate 0 on the long term response, conversely the aquifer is confined/semiconfined when values stay constant or approximate 1 on the long term response. Removing barometric effects is sometimes necessary to correctly interpret a pumping test or dress up a piezometric map. Finally a particular analysis of the water level data allows to calculate the harmonic components due to tides and hence some hydrogeological features.

This theoretical approach has been applied to the data gathered for a project study of an unconfined karst aquifer in northern Namibia. Water levels have been monitored during a 10 months period, with hourly readings and by means of four transducers. The data confirmed the general assumptions obtained during preceding investigations and have underlined the importance of the use of such instruments for aquifer assessment, showing particularly:

  1. The role of the recharge due to rainfall and high transmissivity around Harasib lake area
  2. The good hydraulic connection and conductivity for the aquifer
  3. The lack of confining layers (it’s a deep and rigid unconfined aquifer)
  4. The storage effect of the unsaturated part, above the water table, that starts draining when rain exceeds 400/500 mm
  5. The other pressure effects, such earth tides, can be highlighted using water level transducers

Acknowledgements

Namgrows stands for Namibian Groundwater Systems, a project set up by the author and the colleague Gérald Favre, with the participation of geologists and cavers from 4 different countries (Italy, Switzerland, Namibia, South Africa). The project was supported in Namibia by eng. Sarel La Cante and his wife Leoni Pretorius (Harasib farm).

The company STS – Italia sponsored us by providing the water level sensors and its technical support.

I also wish to thank prof. Todd Rasmussen (The University of Georgia, Athens)  for providing his valuable insights into the data and particularly those regarding the barometric efficiency and earth tides.

 Source: Dr. Alessio Fileccia / Consulting Geologist

Subscribe To Our Newsletter

Join our mailing list to receive the latest news and updates from our team.

You have Successfully Subscribed!