Characteristic curve, hysteresis, measurement error: Terminology in pressure measurement technology
The first data sources for users of pressure measurement technology are often the data sheets supplied by the manufacturers. Of particular interest here is usually the accuracy data. In this context, a large number of terms appear whose comprehension is of great importance in assessment of that particular measurement instrument.
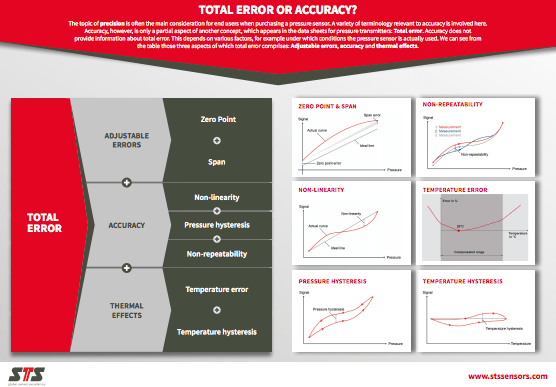
On the topic of accuracy, it can be fundamentally stated that the term itself is not subject to any defined standard. This, however, is not the case for the terminology arising in association with accuracy specifications, including characteristic curve, hysteresis, non-linearity, non-repeatability, and measurement error. In the following, we will briefly explain these terms.
Characteristic curve
The characteristic curve indicates the dependence of the output signal (measured value) upon the input signal (pressure). In the ideal scenario, the characteristic curve will be a straight line.
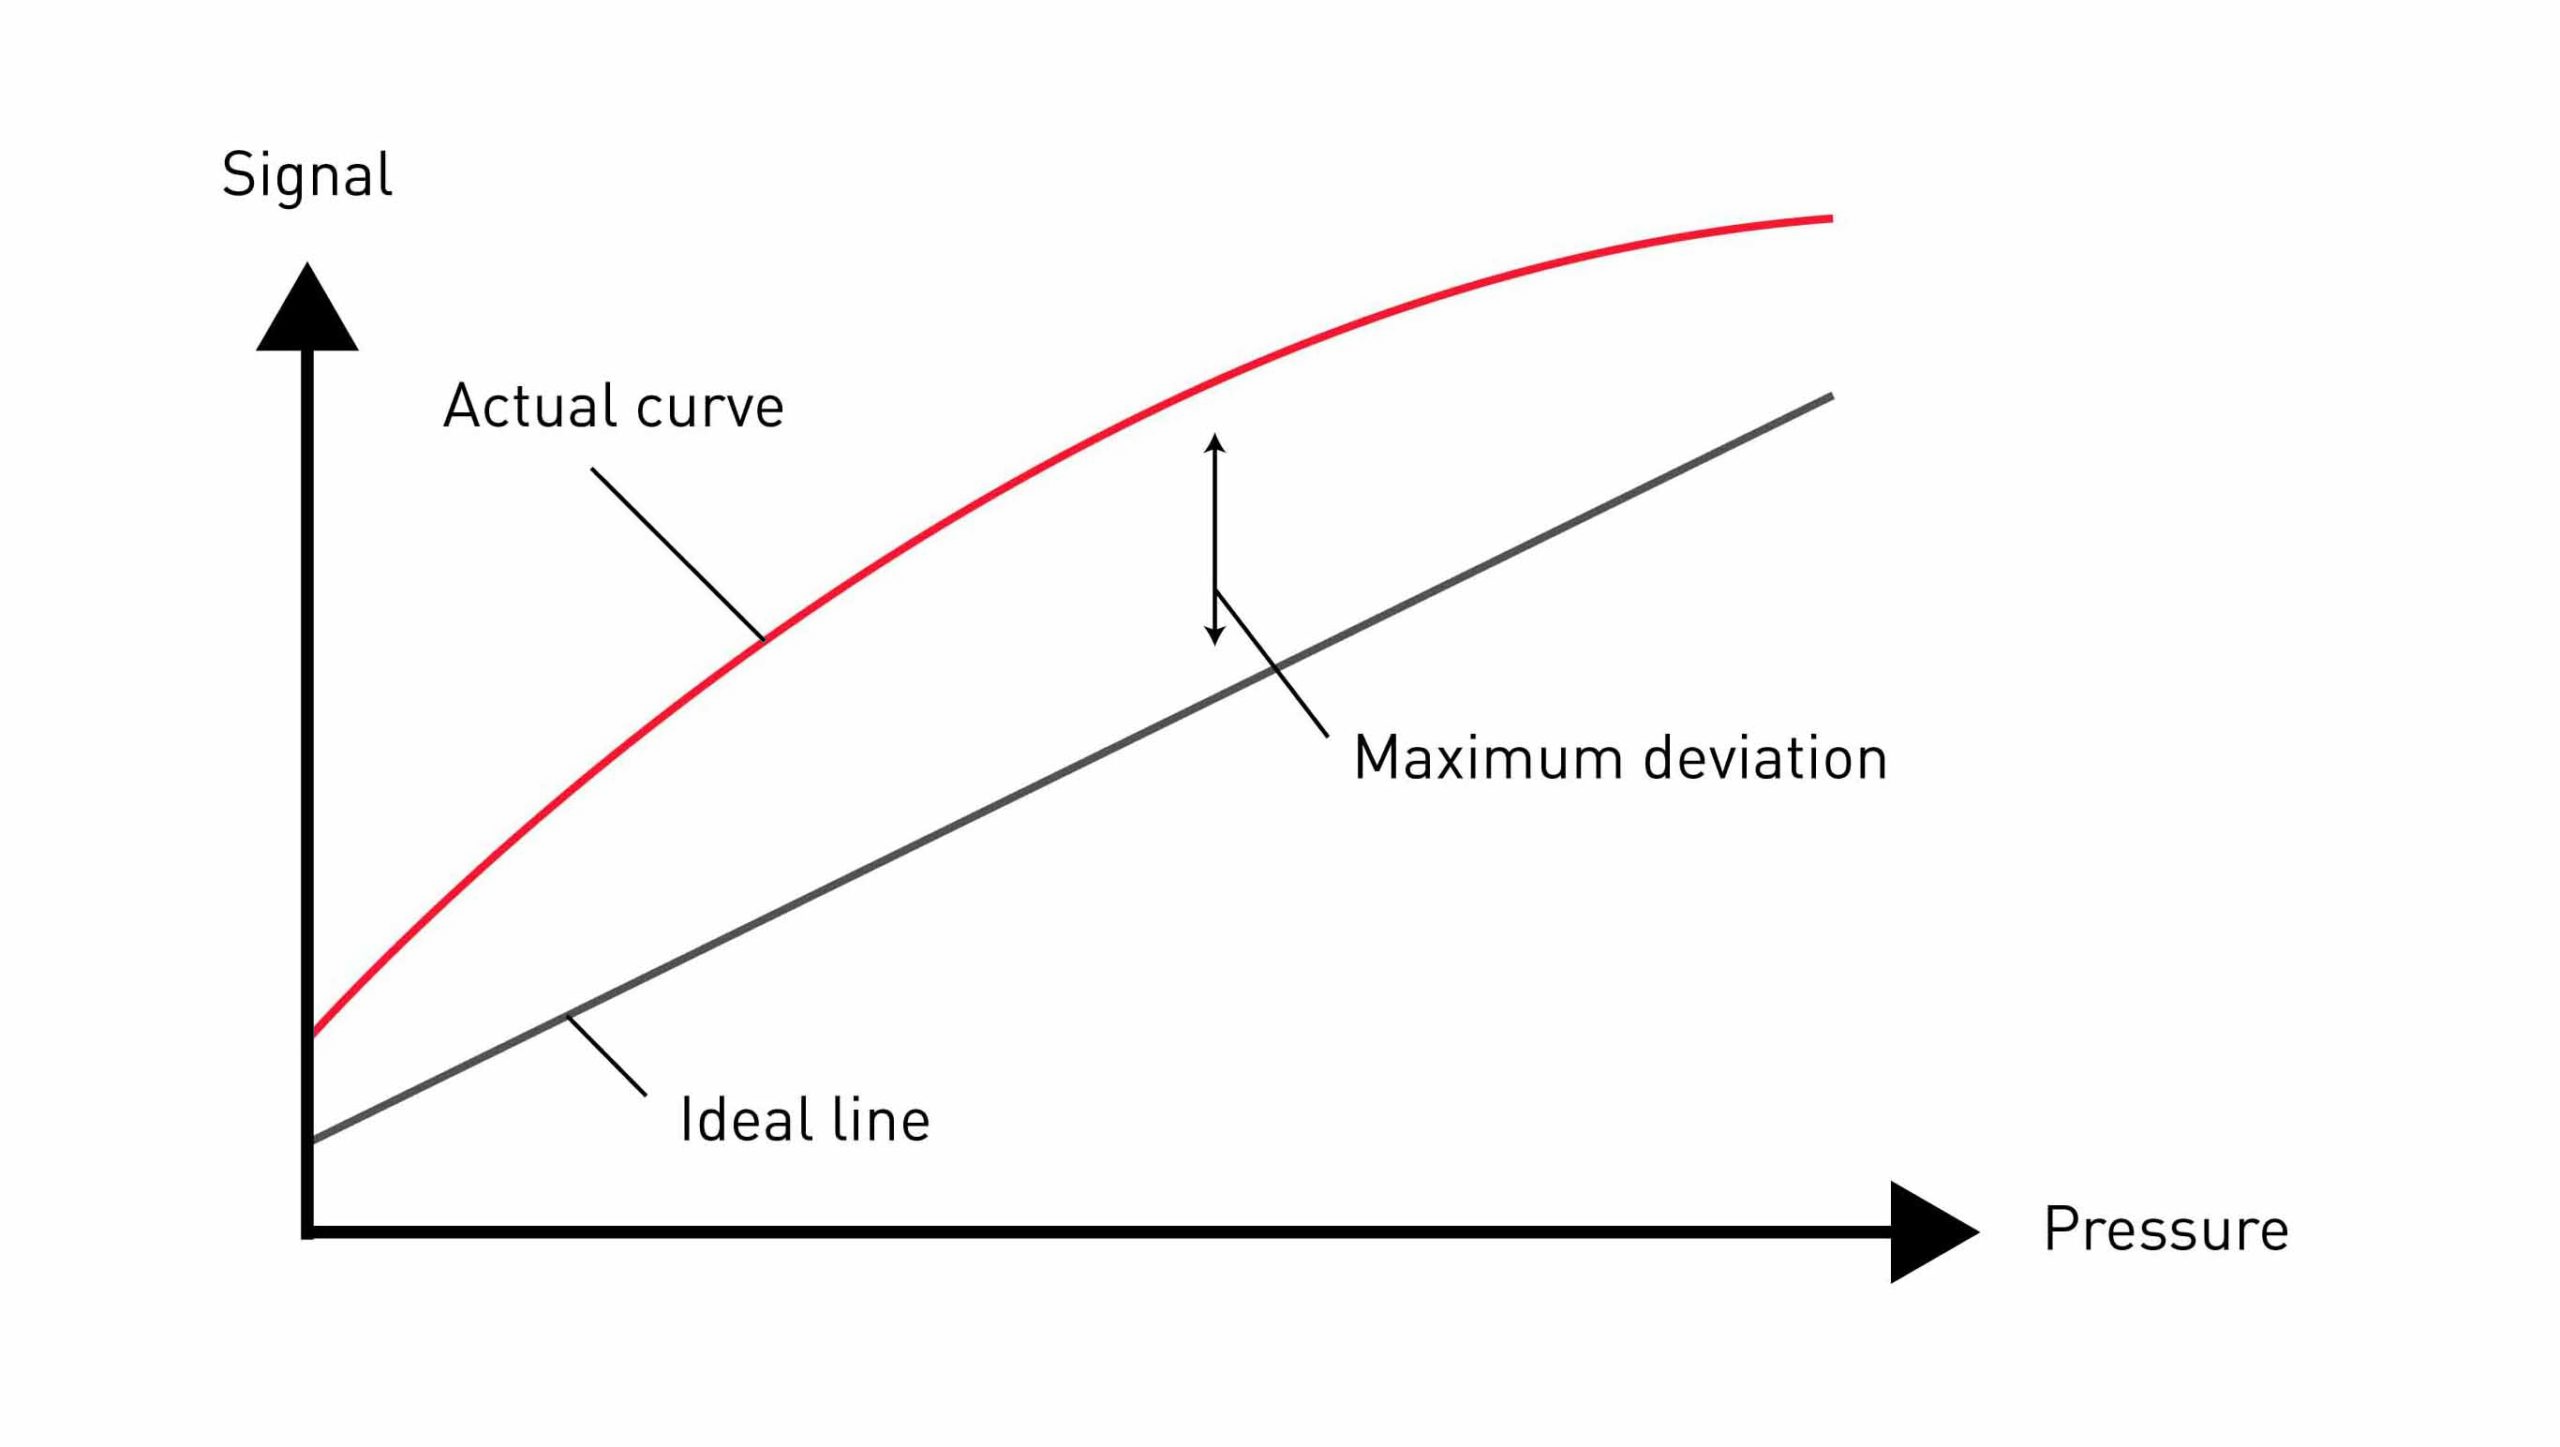
Non-linearity
The greatest deviation (positive or negative) of the characteristic curve from a reference line is described as non-linearity. The reference line itself can be determined by three different methods: End Point adjustment, Best Fit Straight Line(BFSL) and Best Fit Through Zero. Each of these methods arrives at different results, with Limit Point adjustment being the most commonly used method in Europe. The reference line here runs through the start and end point of the characteristic curve.
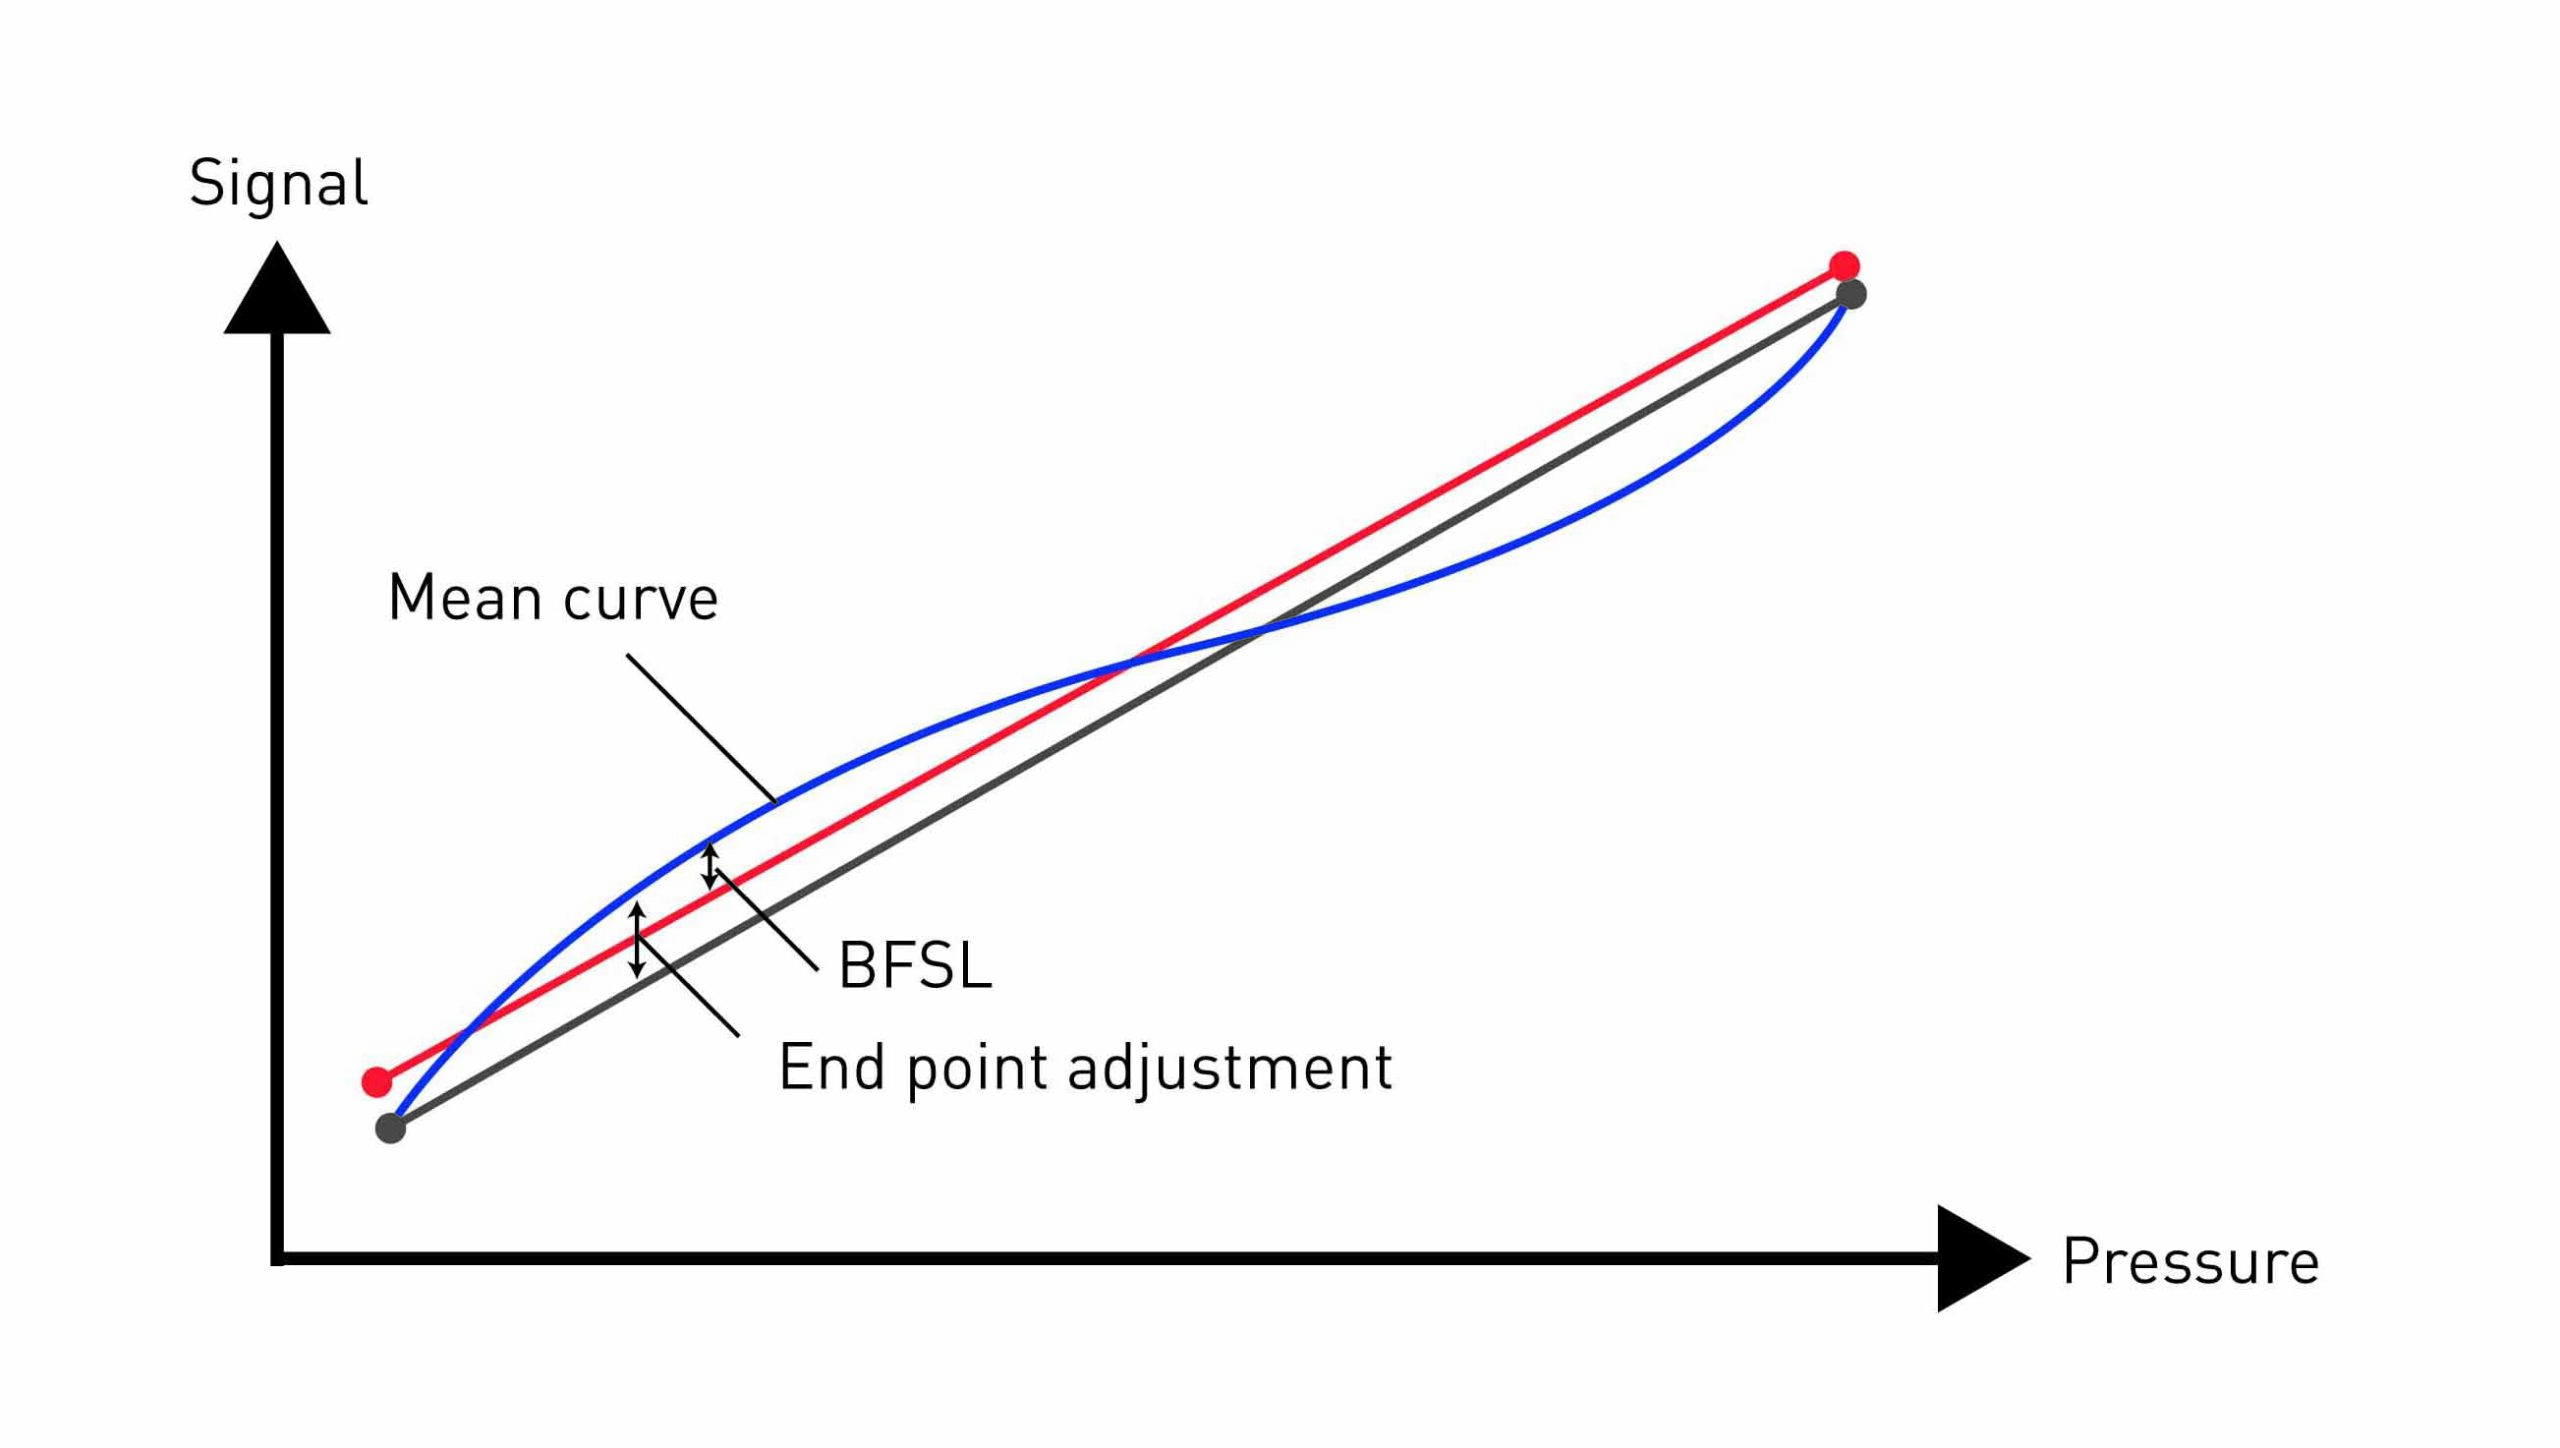
Measurement error
The measurement error, or measurement deviation, describes the shift of the displayed value from the “correct” value. This “correct” value is an ideal one, which in practice can only be attained with a highly accurate measuring device under reference conditions, such as a primary standard as would be used in calibration. The measurement error is expressed as either an absolute or a relative error. Absolute error is listed in the same units as the measured value, whereas relative error refers to the correct value and remains unit-free.
Zero point and span errors
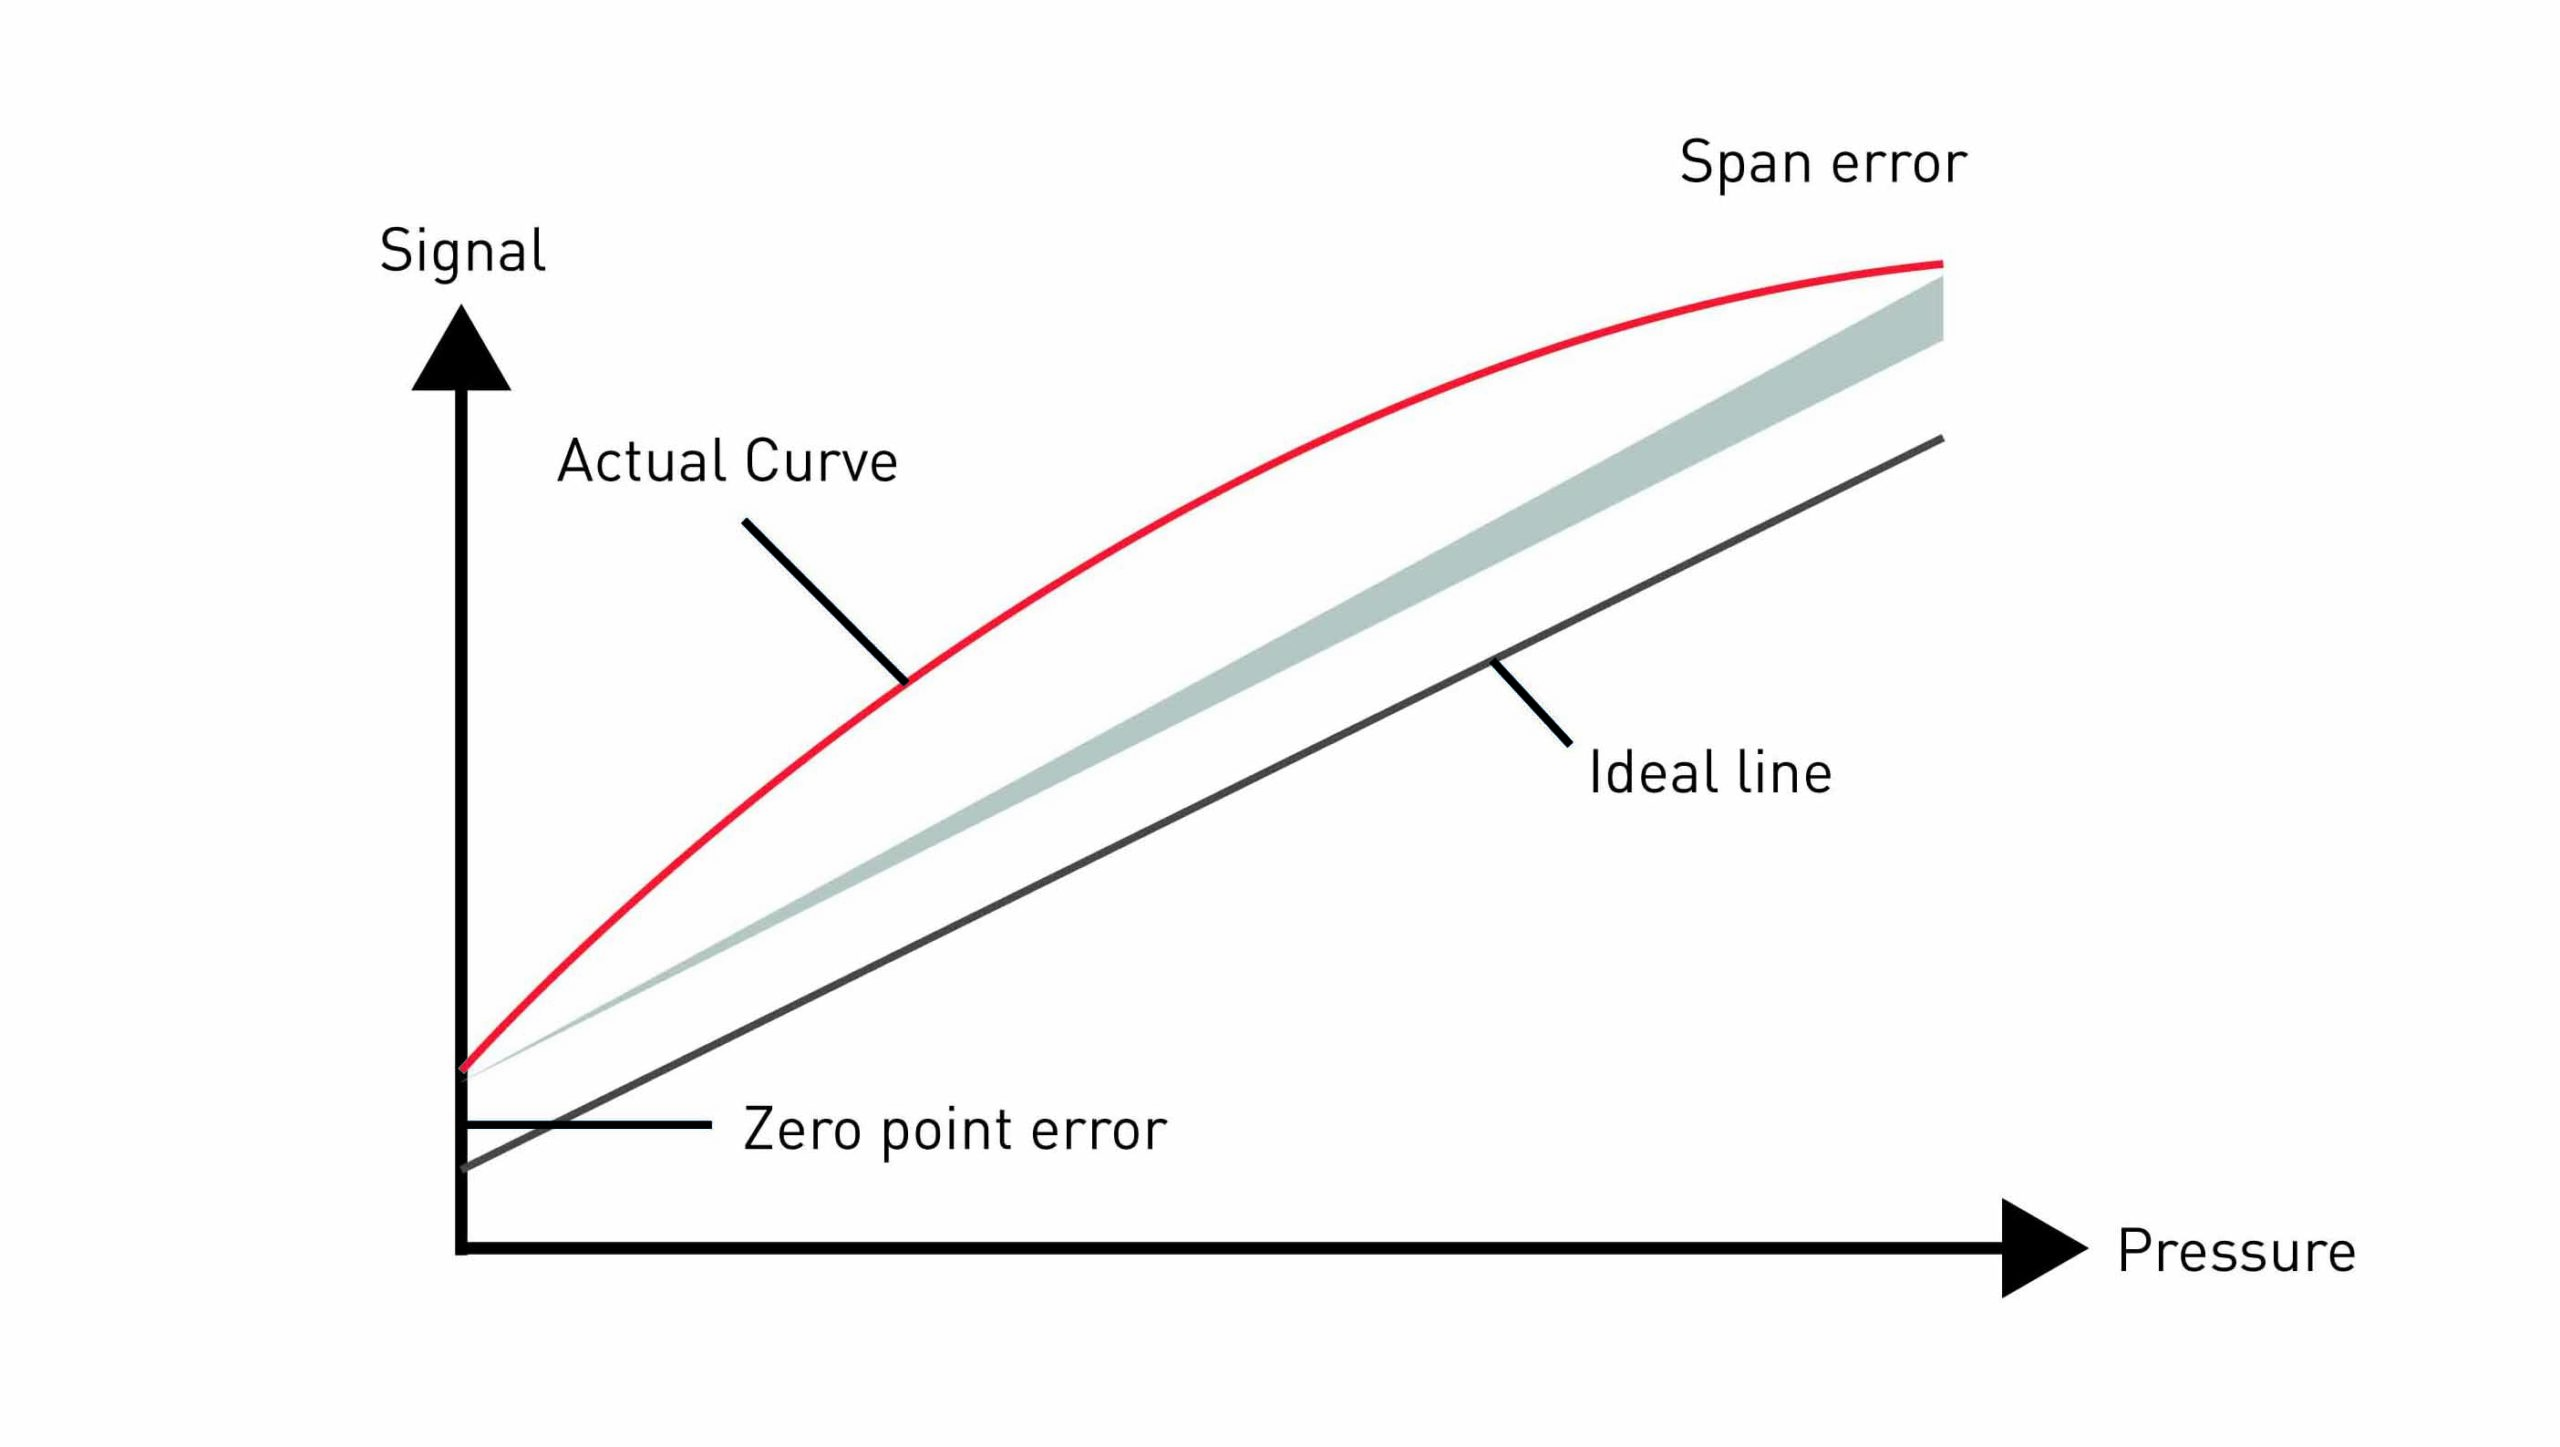
In sensor production, there are deviations from the reference device (standard). Measurement deviations at the measuring range start and end points are referred to as zero point and span errors. The latter relates to the difference between the two values. The zero point error is the difference between the ideal zero point of the target characteristic line and the true output value of the actual characteristic curve.
Zero point error can be easily read off by the user in an unpressurized state. In order to eliminate it, the user must then enter this as an offset into the evaluation unit. Elimination of the span error is somewhat more difficult, since the pressure at the end of the measuring range must be approached precisely.
Hysteresis
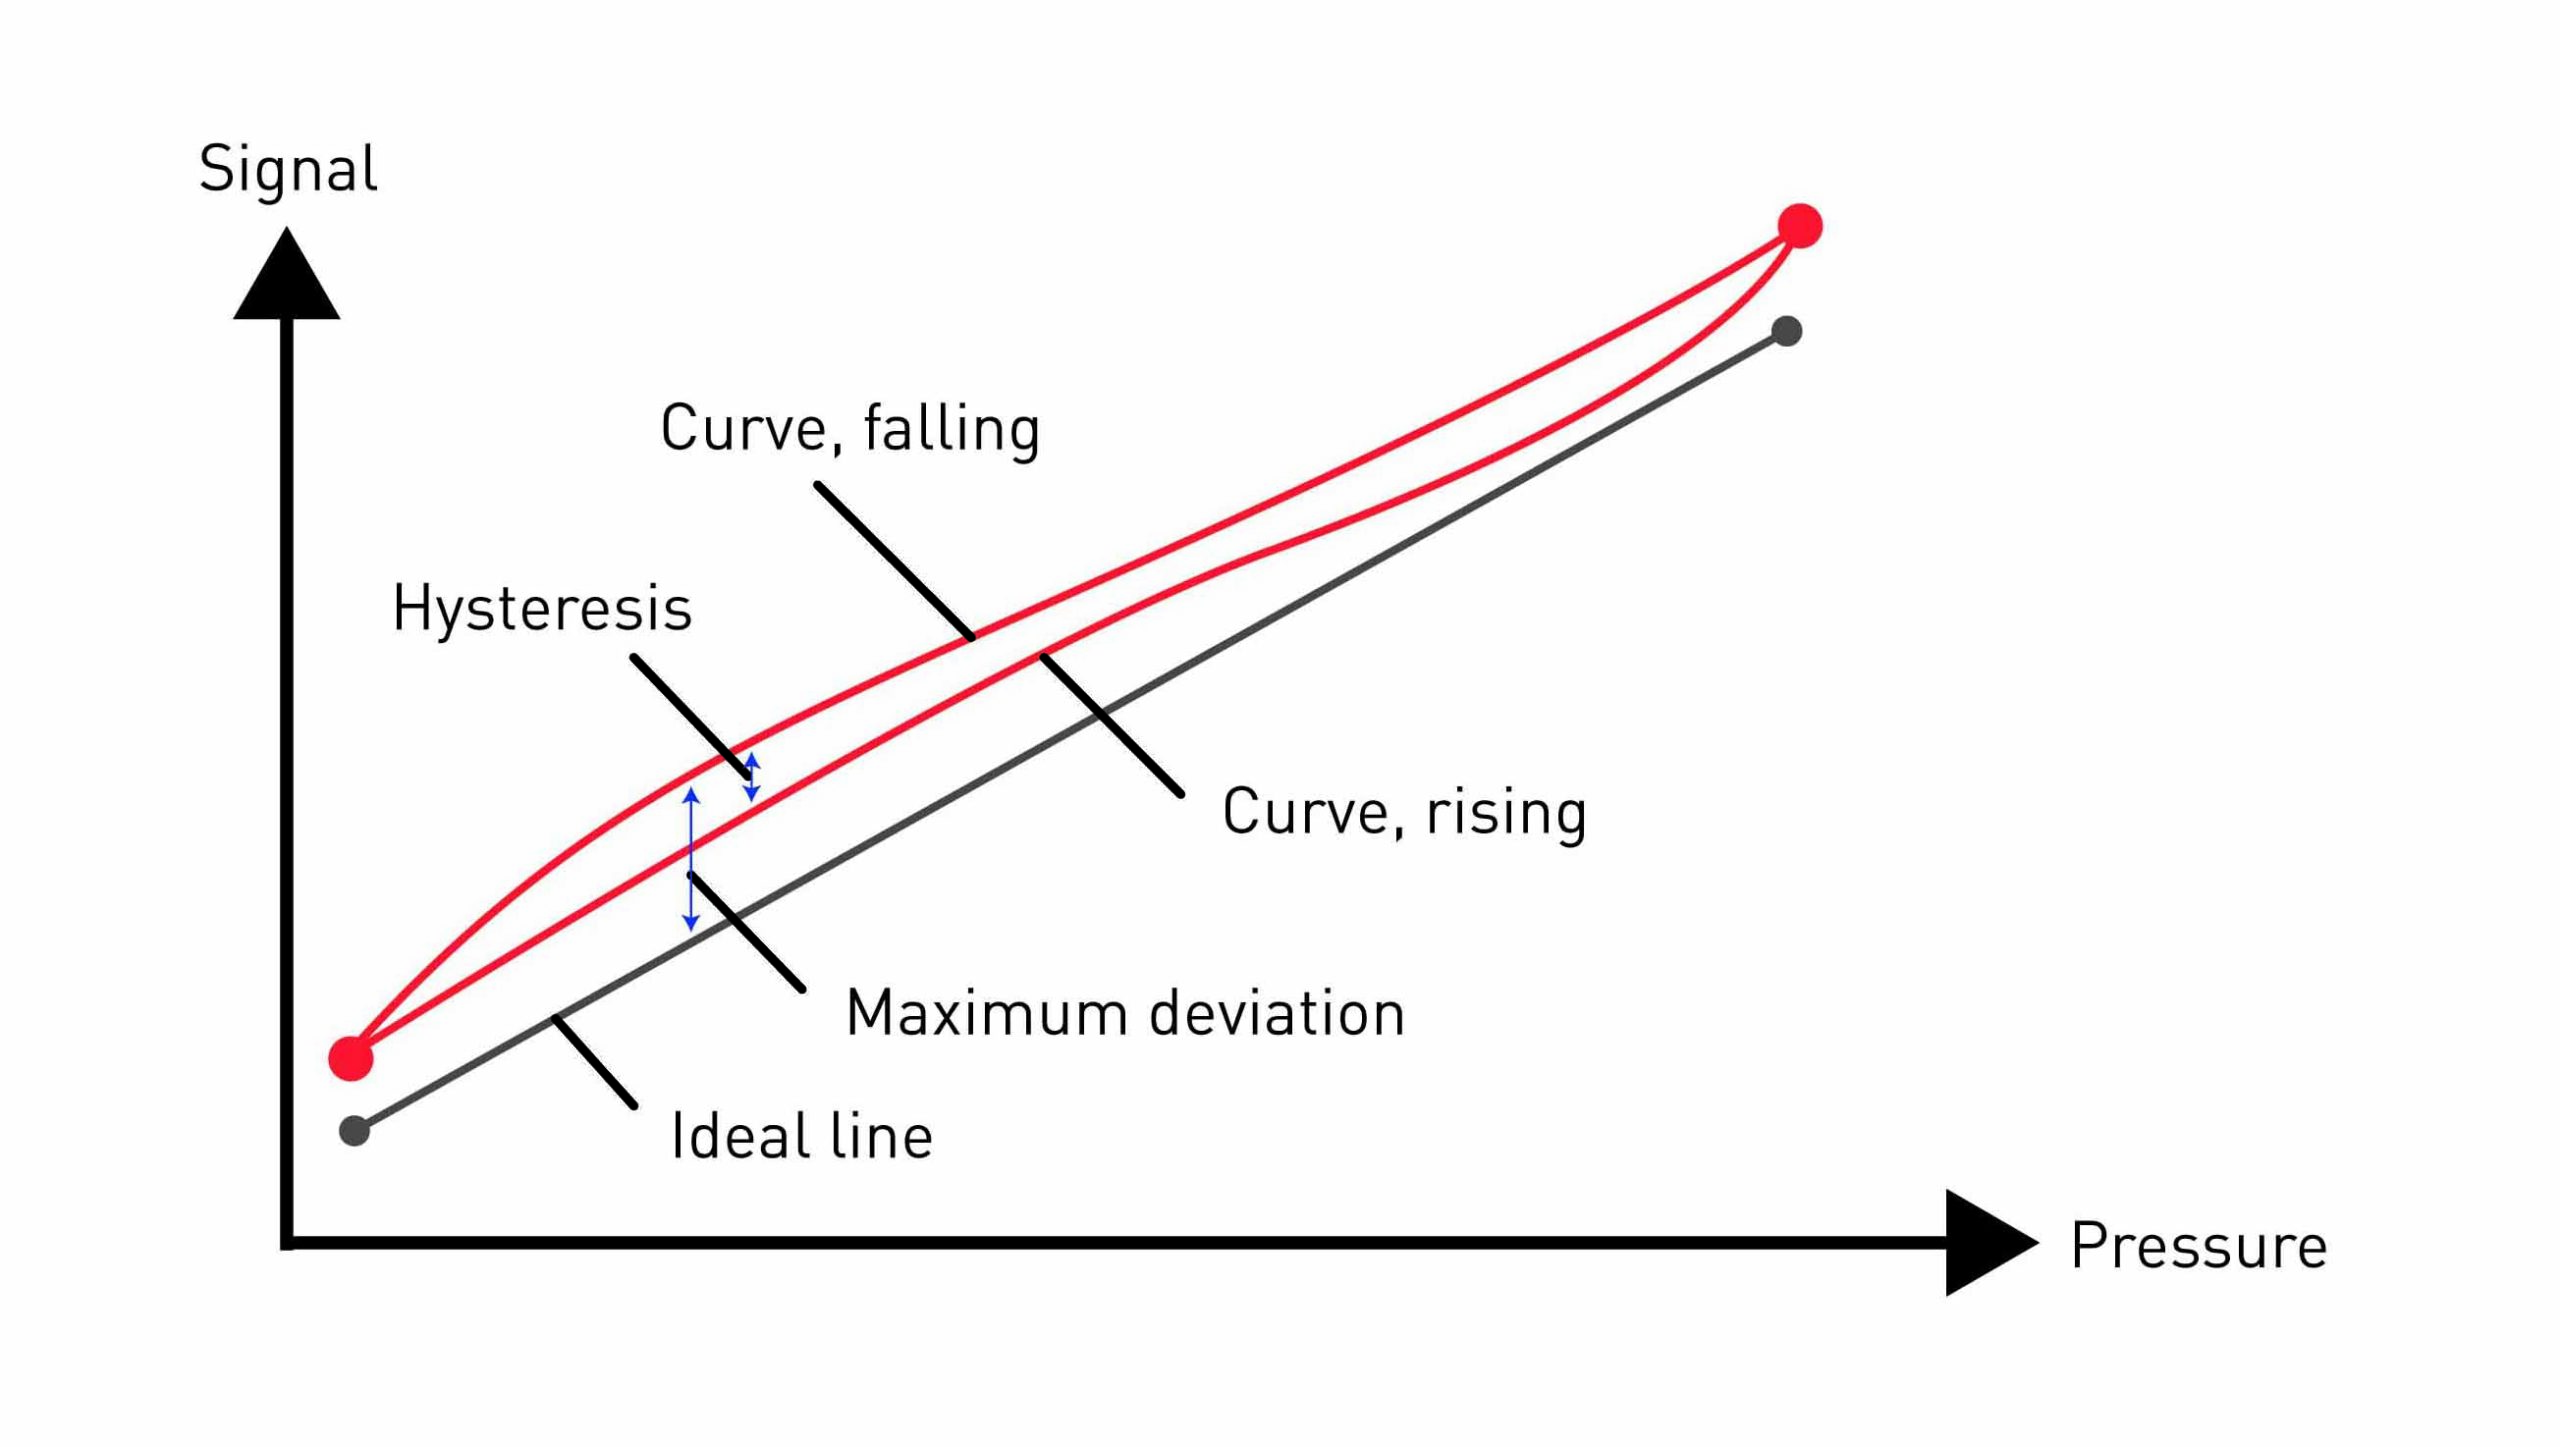
The displayed value measured depends not only on the input variable (here, pressure), but also on the values measured previously from the input variable.
If the characteristic curve of the measuring device is recorded with continuously increasing pressure and then compared with the characteristic curve at continuously decreasing pressure, it is noticeable that the output signals, despite identical pressures, are not themselves exactly identical. The maximum deviation between these two characteristic curves is termed hysteresis and is expressed as a percentage of full scale (% FS).
Non-repeatability
Even when measured under identical conditions, electronic pressure transmitters are subject to stochastic influences, because of which the output signal is not identical at the same pressure values over successive measurements. The biggest deviation over three successive measurements taken from the same direction of approach is thus expressed as non-repeatability. A reliable pressure measuring device is recognized by users from its lowest possible non-repeatability.
Similar to hysteresis, non-repeatability cannot be compensated for.
Temperature error
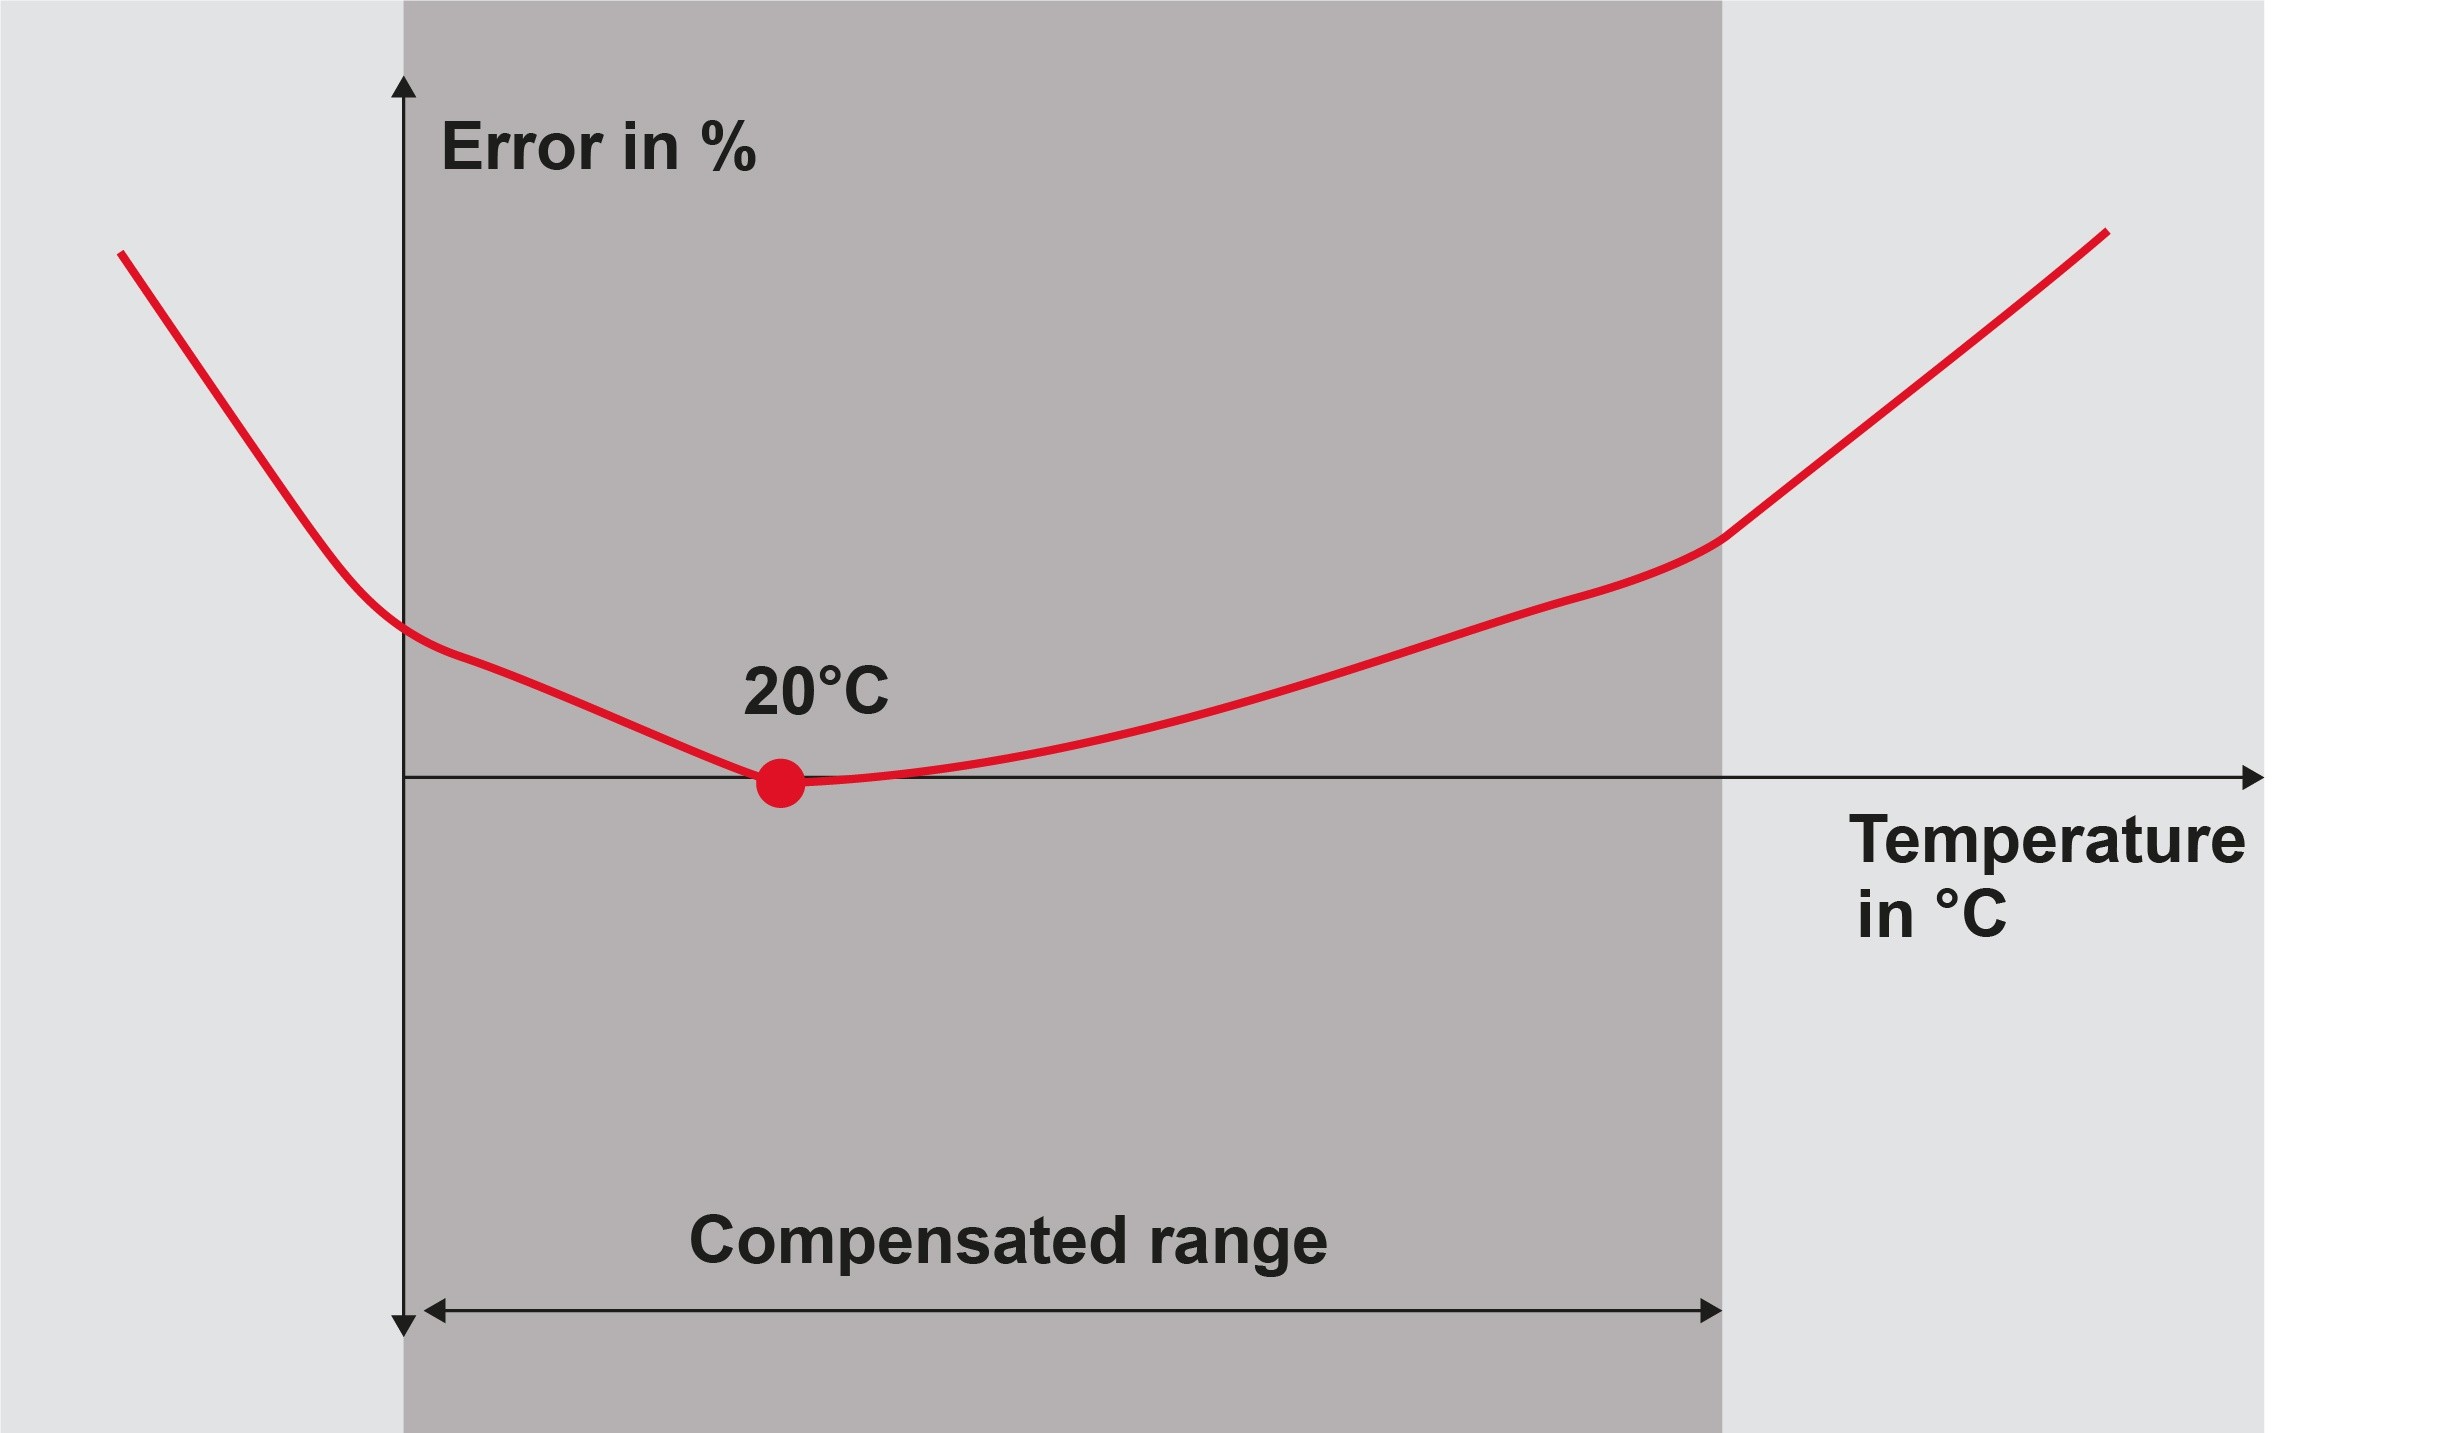
Temperature changes directly affect the characteristics of a pressure sensor. The electrical resistance of semiconductors, as used in piezoresistive pressure transmitters, decreases with increasing temperature, for example. Manufacturers therefore optimize their products by way of a balanced thermal characteristic. Temperature-related errors are either compensated for directly on the sensor or are performed electronically. Some devices also have a temperature sensor that directly compensates for these temperature-related errors. All the same, errors such as this can only be minimized but not completely eliminated. This residual temperature error is indicated by some manufacturers as a temperature coefficient.
Overload pressure – Overpressure
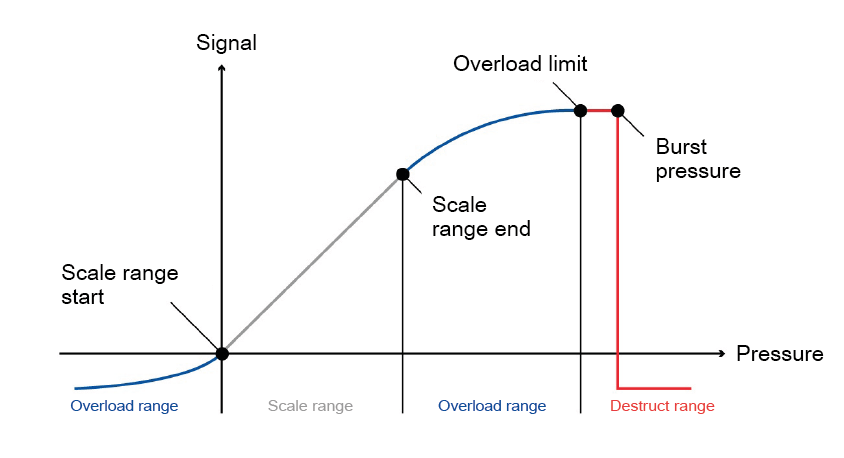
The specified error limits are exceeded into the overload range. The pressure transmitter, however, suffers no lasting damage.
Burst pressure
The burst pressure indicates the pressure at which deformation of the pressure transducer occurs, where it becomes mechanically damaged.
Long-term stability
External influences affect the measuring instrument. For this reason, the characteristic curve does not remain constant over years of use. The long-term stability (also long-term drift) is determined by manufacturers under laboratory conditions and listed in data sheets as a percentage of full scale per annum.
The actual operating conditions of the device can however differ significantly from the test conditions. Test procedures between manufacturers can also vary widely, which makes comparability of the data even more difficult. In general, it is recommended that the pressure transducer be calibrated at regular intervals and, if necessary, adjusted.
Accuracy: Non-conformity of a curve
As mentioned at the outset, “accuracy“ is not a fixed value. Another term occasionally used for accuracy is non-conformity of a curve. This describes the maximum total error according to IEC 770 and comprises the linearity deviation and hysteresis, as well as non-repeatability. It is therefore the deviation from the ideal characteristic line at the end value of the measurement range and is expressed as a percentage.
Download the free STS infographic on total error here:
