Calibration of pressure transmitters

Calibration of pressure transmitters

Because of mechanical, chemical or thermal influences, the precision of a measuring device alters over the course of time. This aging process is normal and cannot be overlooked. It is therefore essential to recognize these alterations in good time by means of calibration.

The calibration of pressure gauges is important for various reasons. On the one hand, it is about adherence to established standards such as ISO 9001, to mention just one. Manufacturers, on the other hand, also gain very specific advantages, such as process improvements and cost savings (by using the correct quantities of raw materials, for example). This can prove very worthwhile, since a study performed by the Nielsen Research Company in 2008 shows that the costs of defective calibration to producing companies average 1.7 million dollars per annum. Furthermore, calibration must also be viewed as a central component of quality assurance. In some sectors, such as the chemical industry, consistent and error-free calibrations are also a factor relevant to safety.

Definition: Calibration, adjustment and verification

The terms calibration, adjustment and verification are often used synonymously. All three terms, however, contain significant differences. In the case of calibration, the display of the measuring instrument to be tested is compared to the results from a standard. The standard here is a reference device, the precise function of which remains assured. Using comparative measurements, each measuring device must be capable of being traced back to a national standard through a chain of comparative measurements (“traceability”). For the primary standards, meaning those at the very top of the calibration hierarchy, deadweight testers are generally used for pressure gauges (as are piston manometers), which are employed in national institutes and calibration laboratories.

During adjustment (also termed alignment), an intervention takes place in the measuring device to minimize measurement errors. The intent here is to correct those inaccuracies arising from aging. Adjustment therefore generally precedes a calibration and a direct intervention is performed on the measuring device here. A further calibration is thus also carried out following an adjustment in order to check and document that correction.

Verification involves a special form of calibration. It is always applied whenever the device to be tested is subject to legal controls. This is always the case when accuracy of measurement lies in the public interest. It is also always the case when the measured results have a direct influence on the price of a product. One example here would be the flow meters installed at filling stations. In Germany, validation is the area of responsibility of the National Weights and Measures Office and state-approved test centers.

The calibration of pressure gauges: Requirements

Before calibration, the actual calibration capability of the measuring device must first be determined. The German Calibration Service (DKD) has published the DKD-R 6-1 directive for the calibration of pressure gauges. When calibrating mechanical pressure gauges, the DKD stipulates a number of tests, which are divided into appearance tests (including visual inspection for damage, contamination and cleanliness, visual inspection of labeling) and functional tests (integrity of line system of calibrated device, electrical functionality, faultless function of control elements).

In the next chapter of the DKD-R 6-1 directive, the DKD points out the environmental conditions for calibration, where the calibration is to be performed at a stable environmental temperature. Additionally, it would be ideal if it were carried out under the actual operating conditions of the measuring instrument itself.

The calibration of pressure gauges: Procedure

Once the calibration capability is determined and the environmental conditions are ideal, the actual calibration can then begin. The pressure gauge should preferably be calibrated here as a whole (measuring chain), with the prescribed mounting position also be taken into consideration.

In the DKD-R 6-1 directive of the DKD, different calibration cycles are described for different accuracy classes. At this point, we will limit ourselves to calibration cycle A for the accuracy class of <0.1. This calibration cycle also happens to be the most extensive.

Calibration sequences according to DKD-R 6-1 directive

When calibrating devices of accuracy class A, the DKD stipulates three loads up to the full measurement range before the actual measurement sequences are carried out. In each instance, the maximum pressure must be maintained for 30 seconds before being fully released.

Next, nine points evenly distributed across the measurement range are to be reached by continuous pressure increase. The zero-point is deemed the first measurement point here. The target measuring points have to be reached “from below”. As a result, the pressure increase can only be performed slowly. If a target point is overshot, then the resulting hysteresis leads to a falsification of the results. In this case, the pressure must be drastically reduced in order to reach from below the measurement point to be attained. Once the value is reached, this must also be held for at least 30 seconds before it is actually read.

This process is then repeated for all remaining measurement points. But the final point holds one peculiarity, since this is held for a further two minutes and then read anew and documented.

Once completed, the second stage of the first sequence can begin. This now takes place in reverse, where the individual measurement points are reached from top to bottom. The pressure should be reduced only slowly here so that this time the target value is not undershot. This second measurement sequence ends with a reading at the zero-point.

The second measurement sequence can begin after the meter has been in a pressureless state for three minutes. The cycle of raising and lowering pressure over the individual measuring points is now repeated.

Calibration sequence A according to DKD-R 6-1 directive

In-house calibration of pressure transmitters

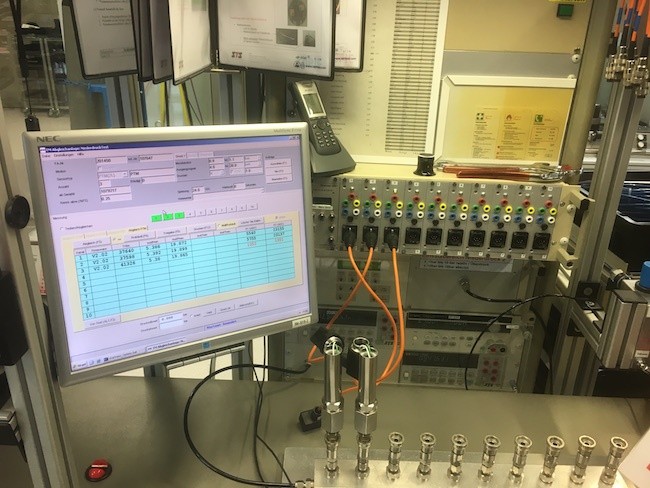
In most industrial applications, calibration by a specialist laboratory is not necessary and often also not practical. For the calibration of pressure gauges on-site, portable pressure calibrators would be suitable. These are not as precise as a deadweight tester, but as a rule are completely sufficient. In these hand-held devices, working standards and pressure generation are combined together. When calibrating a pressure transmitter, a zero-point calibration is carried out with the valves open, once the pressure and electrical connections between the transmitter and test instrument have been established. The individual pressure testing points can then be controlled with the integrated pump. The resulting electrical signals are measured and stored via integrated data loggers, where this data can then be read out on a PC.

The Long-Term Stability of Pressure Sensors

The Long-Term Stability of Pressure Sensors

Factors such as temperature and mechanical stress can have negative effects on the long-term stability of pressure sensors. However, the effects can be minimized by diligent testing during production.

Manufacturers usually indicate the long-term stability of their pressure sensors in data sheets. The value given in these data sheets is determined under laboratory conditions and it refers to the expected maximum change of zero point and output span in the course of a year. For example, a long-term stability of < 0.1 % FS means that the total error of a pressure sensor may deteriorate by 0.1 percent of the total scale in the course of one year.

Pressure sensors usually take some time to “settle in”. As already mentioned, zero point and sensitivity (output signal) are the main factors to be mentioned here. Users usually notice zero point shifts as they are easy to recognize and to adjust.

How can the long-term stability be optimized?

In order to achieve the best possible long-term stability, which means that only minor shifts occur during the product lifetime, the core element must be right: the sensor chip. A high-quality pressure sensor is the best guarantee for optimal long-term functionality. In the case of piezoresistive pressure sensors, this is the silicon chip on which the Wheatstone bridge is diffused. The foundation of a stable pressure sensor is already laid at the beginning of the production process. A diligent qualification of the silicon chip is hence paramount to the production of pressure sensors with great long-term stability.

The assembly of the sensor is decisive as well. The silicon chip is glued into a casing. Due to the effects of temperature and other influences, the glued-in chip may move and thus also effect the mechanical stress exerted on the silicon chip. Increasingly inaccurate measurement results are the consequence.

Practice has shown that a new sensor takes some time to really stabilize – especially in the first year. The older a sensor, the more stable it is. In order to keep undesirable developments to a minimum and to be able to better assess the sensor, it is aged and subjected to some testing before it leaves production.

How this is done varies from manufacturer to manufacturer. To stabilize new pressure sensors, STS treats them thermally for over a week. The “movement”, which is prone to occur in the sensor in the first year, is thus anticipated to a large extent. Therefore, the thermal treatment is a form of artificial aging.

Image 1: Thermal treatment of piezoresistive pressure measurement cells

The sensor is subjected to further tests in order to characterize it. This includes assessing the behavior of the individual sensor under various temperatures as well as a pressure treatment in which the device is exposed to the intended overpressure over a longer period of time. These measurements serve to characterize each individual sensor. This is necessary in order to make reliable statements about the behavior of the measuring instrument at different ambient temperatures (temperature compensation).

Hence, long-term stability largely depends on the production quality. Of course, regular calibrations and adjustments can help correct any shifts. However, this should not be necessary in most applications: Properly produced sensors will work realiably for a really long time.

How relevant is the long-term stability?

The relevance of long-term stability depends on the application. However, it is certainly of greater importance in the low pressure range. On the one hand, this is due to the fact that external influences have a stronger effect on the signal. Small changes in the mechanical stress of the chip have a greater effect on the precision of the measurement results. Furthermore, pressure sensors produced for low pressure applications are based on a silicon chip whose membrane thickness is often smaller than 10 μm. Therefore, special care is required here during assembly.

Image 2: Detailed view of a bondend and glued silicon chip

Despite all care, an infinite long-term stability and also accuracy is physically impossible. Factors such as pressure hysteresis and temperature hysteresis cannot be completely eliminated. They are, so to speak, the characteristics of a sensor. Users can plan accordingly. For high-accuracy applications, for example, pressure and temperature hysteresis should not exceed 0.02 percent of the total scale.

It should also be mentioned that the laws of physics place certain limits on a sensor’s long-term stability. Wear and tear is to be expected in particularly demanding applications such as applications with fluctuating, high temperatures. Constant high temperatures beyond 150 °C eventually destroy the sensor: the metal layer, which serves to contact the resistors of the Wheatstone bridge, diffuses into the silicon and literally disappears.

Users who use pressure measurements under such extreme conditions or demand the highest level of accuracy should therefore thoroughly discuss options with manufacturers in advance.

Position can influence the accuracy of pressure transmitters

Position can influence the accuracy of pressure transmitters

The accuracy of a pressure measurement can definitely be influenced by the position of the pressure transmitter. Particular attention to this should be paid in the low-pressure range.

When it comes to position dependence, inaccuracies can occur if the position of the pressure transmitter differs in practice from that used during the calibration process at the manufacturer. At STS, the norm is for pressure transmitters to be calibrated in a vertical position pointing downwards (see accompanying image above). If users now mount one of these calibrated pressure sensors in the opposite position, i.e. pointing vertically upwards, then inaccuracies may occur during the pressure measurement.

The reason for this is simple. In the latter position, the actual weight of the pressure transmitter will influence its precision. The membrane, filling body and transmission fluid act upon the actual sensor chip due to the gravitational force of the earth. This behavior is common to all piezoresistive pressure sensors, but it is only of importance in the low-pressure range.

Installation of pressure transmitters: Caution in the lower pressure ranges

The lower the pressure to be measured, the higher in this case the measurement error will be. With a 100 mbar sensor, the measurement error amounts to one percent. The higher the measuring range, the lower the effect becomes. Starting from a pressure of 1 bar, this error becomes practically negligible.

This measurement inaccuracy can be easily detected by users, especially when a relative pressure sensor is used. If users are working in the low-pressure range and it is not possible to mount the measuring instrument in the position in which it was factory calibrated, it should then be recalibrated in its actual position. Alternatively, users can also compensate for the measurement error themselves numerically on the control unit.

This additional effort can, of course, be easily avoided through competent application advice. Although STS pressure transmitters are calibrated vertically downwards as standard, it is easily possible to carry out the calibration in a different position. Our advice is to communicate the mounting position of your pressure transmitter with us in advance and you will then receive a measuring instrument perfectly matched to your application.

We will be only too happy to advise you!

Total error or accuracy?

Total error or accuracy?

The topic of precision is often the main consideration for end users when purchasing a pressure transmitter. A variety of terminology relevant to accuracy is involved, which we have previously explained here. Accuracy, however, is only a partial aspect of another concept, total error, which also appears in the data sheets for pressure transmitters. In the following, we will explain how this designation is to be understood in data sheets and what role it should play in selection of the appropriate pressure sensor.

It can be firstly stated that accuracy does not provide information about the total error. This depends on various factors, such as under which conditions the pressure sensor is actually used. We can see in Figure 1 the three aspects of which total error consists: Adjustable errors, accuracy and thermal effects.

Figure 1: Origins of total error

As we see in the illustration above, the partial aspect of adjustable error consists of the zero point and span errors. The designation ‘adjustable error’ results from the fact that zero point and span errors can each be easily identified and adjusted. These are thus errors that users need not live with and indeed both have already been factory-corrected in pressure sensors of STS manufacture.

Long-term stability, also known as long-term error or long-term drift, is the cause of zero point and span errors during operation. This means that these two adjustable errors may reappear or even “worsen” after prolonged use of the sensor. By means of calibration and subsequent adjustment, this long-term drift can thus be corrected again. Read more about calibration and adjustment here.

Accuracy

The partial aspect of accuracy also appears in data sheets under the term ‘characteristic curve deviation’. This lack of conceptual clarity comes down to the fact that the term “accuracy” itself is not subject to any statutorily defined standard.

The term encompasses the errors of non-linearity, hysteresis (pressure) and non-repeatability (see Figure 2). Non-repeatability describes those deviations observed when a pressure is applied several consecutive times. Hysteresis refers to the fact that the output signals can differ at the exact same pressure when this is approached from a “rising” and “falling” direction. Both of these factors, however, are very minor in piezoresistive pressure transducers.

The biggest influence on accuracy, and thus also on total error, comes down to non-linearity. This is the greatest positive or negative deviation of the characteristic curve from a reference line at increasing and decreasing pressure. Read more on the terminology here.

Figure 2: The greatest difference in the characteristic curve when the pressure to be measured is approached several times is termed non-linearity.

Thermal effects

Temperature fluctuations have an influence on the measured values of a pressure sensor. There is also an effect known as temperature hysteresis. In general, hysteresis describes the deviation of a system when the same measuring point is approached from opposing directions. In the case of temperature hysteresis, this hysteresis describes the difference (error) of the output signal at a certain temperature when that specific temperature is approached from a lower or from a higher temperature. At STS this is typically listed at 25 °C.

More on the thermal characteristics of piezoresistive pressure transducers can be found here.

Figure 3: The typical appearance of thermal effects in pressure transmitters.

Total error or accuracy?

The important question that arises from these various aspects, of course, is what users should pay the most attention to in sensor selection. This will vary on a case-by-case basis. Since the aspect of adjustable errors has already been corrected at the factory, this plays only a subordinate role. In this instance, the sensor should in general be recalibrated and adjusted after one year of use.

When purchasing a new sensor, the dual aspects of accuracy and thermal effects now become decisive. The key question in this context is, “Do I perform my pressure measurements under controlled conditions?” This means that when users carry out their measurements near the reference temperature during calibration (typically 25 ° C), the thermal effects can essentially be ignored. The total error designation, however, does become important when pressure measurement is performed over a wide range of temperatures.

Lastly, we will look at a data sheet on the ATM.1st piezoresistive pressure transmitter from STS (Figure 4):

Figure 4: Excerpt from a data sheet (ATM.1st)

The technical specifications for the ATM.1st display both accuracy and total error, where the accuracy entries are broken down into their respective pressure ranges. The given values are derived from non-linearity, hysteresis and non-repeatability at room temperature. Users wishing to perform measurements under controlled temperature conditions (room temperature) can therefore orient themselves toward these accuracy values specified.

The total error depicted in the data sheet, on the other hand, does include thermal effects. In addition, total error is supplemented with the entries of “typ.” and “max.”. The first of these describes the typical total error. Not all pressure sensors are absolutely identical and their accuracy can vary slightly. The precision of the sensors correspond to the Gaussian normal distribution. This means that 90% of the measured values over the entire pressure and temperature range of a sensor correspond to the value designated under typical total error. Those remaining measured values are then attributed with maximum total error.  

Download our free infographic on the subject: 

Subscribe To Our Newsletter

Join our mailing list to receive the latest news and updates from our team.

You have Successfully Subscribed!