Density measurement in gas flow meters

Density measurement in gas flow meters

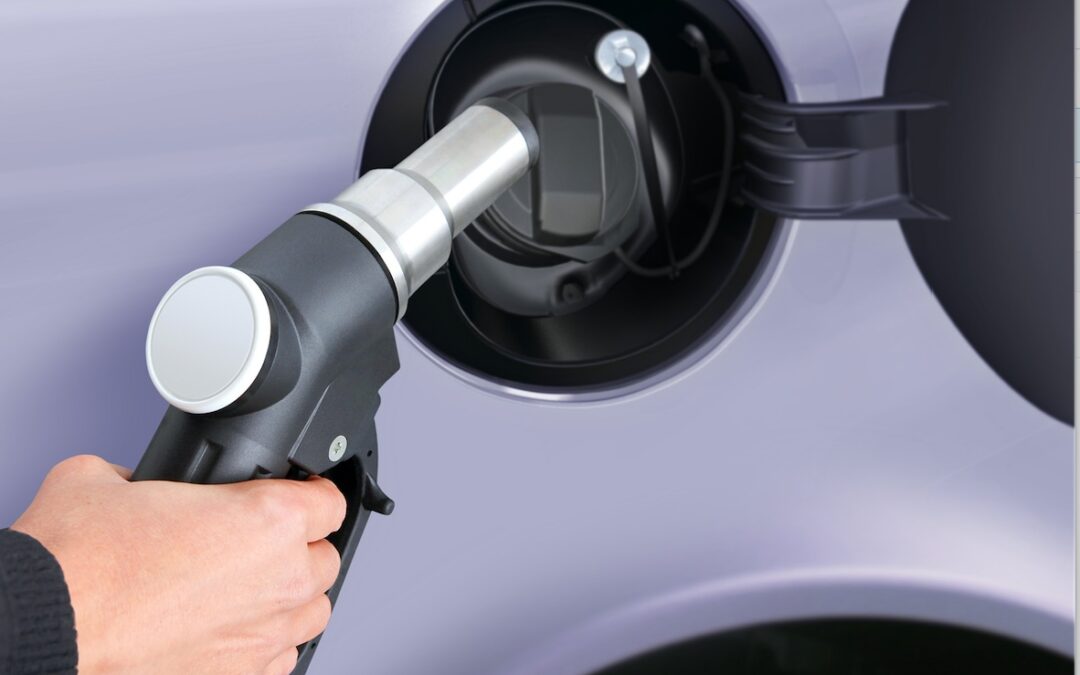
Gas consumption is calculated using gas meters measuring the flow volume. Since the density of gas, and thus its volume also, is both pressure and temperature dependent, the measured quantity can deviate due to the prevailing  pressure or temperature. The gas volume, depending upon pressure and temperature, can be described by the formula p · V/T = Constant (p: pressure, V: volume, T: temperature).

Whilst the pressure with which gas flows through the pipes can be relatively easily controlled and monitored, this is not the case with the temperature. The resulting differences in density have an influence on the measured flow rate. What remains negligible here to the normal consumer due to relatively light usage becomes an important cost factor to those major consumers.

With the Measurement Instruments Directive (MID), an EU-wide guideline for measuring instruments was issued to establish a uniform approval procedure for all EU states and some other nations. Further objectives of the directive include a one-time and unified test for the approval of measuring instruments, as well as a uniform and transnational regulation for initial calibration. With these designated, transnational regulations an even better product quality is striven for and a level playing field ensured. Ten types of measuring instruments in the sphere of legal metrology are covered by the MID, with the requirements for gas meters and volume converters laid out in Annex MI-002.

Pressure and temperature must be taken into account when calculating exact gas quantities. And this requires appropriate sensors in the gas meters. Instead of the volume, the gas mass must be indicated, since this is the more precise measure in light of fluctuating density. To reliably determine this, it is necessary to measure both pressure and temperature and thus determine the density.

High precision through computational compensation

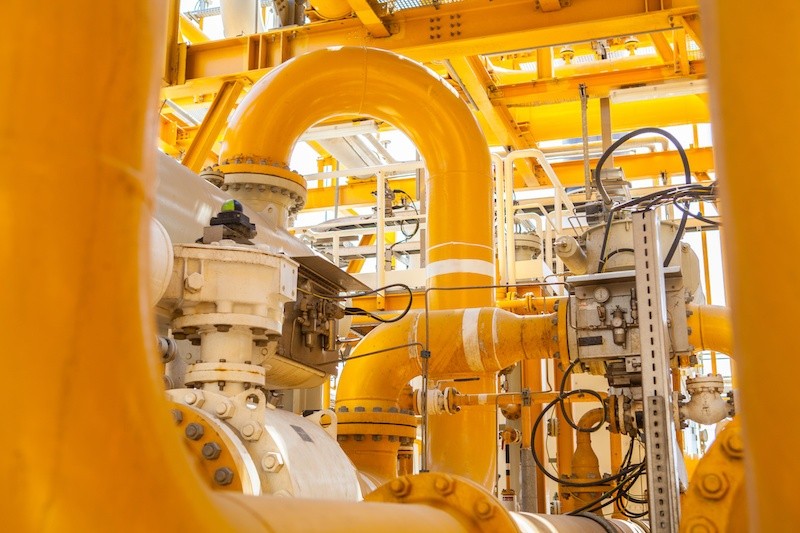
There are two types of pressure and temperature sensors to be connected to gas meters. In the first variant, the pressure transmitter is screwed onto the gas-delivery pipe and connected to the gas meter by means of a cable. In variant two, however, the sensor is installed directly into the device (the specific example below describes variant two).

The pressure ranges used for gas metering generally fall between 0.8 and 3.5 bar (absolute) and 2.5 to 10 bar (absolute). The requirements in terms of precision are enormous: Demanded is 0.2% of the measured value at temperatures from -20 °C to 60 °C. This figure, however, cannot be achieved with conventional pressure sensors. To maintain this level of accuracy, computational compensation must be applied. For this reason, STS supplies its pressure and temperature transmitters not only functionality-tested, but also parameterized (coefficients for polynomial compensation).

Oil prospecting below the seabed

Oil prospecting below the seabed

Science has a more accurate picture of the surface of Mars than of the seabed. An exact knowledge of the nature and layout of the ground below water is necessary for a variety of reasons, including shipping safety, research purposes (archaeology, marine studies) and exploration aims. This also includes the exploration of oil deposits under the seabed.

To identify possible oil reserves below the oceans, the geological characteristics of the seabed must be analyzed. Since this is generally a question of areas very difficult to access and at great depths, the seabed is mapped out using sound by a process known as seismic reflection.

Oil prospecting by the seismic reflection method

In seismic reflection, artificially created seismic waves are examined. These waves spread out under water and, similar to a beam of light at its optical limits, become partially refracted and reflected as they strike upon strata boundaries. At this point, the proportion of the wave reflected at the boundary surface is dependent upon the speed as well as density differences between adjoining strata. These reflected waves then return to the water surface. Both the energy and the time expenditure of this wave motion are recorded by geophones. When the recorded data is then processed, it becomes evident at which depth the respective strata boundaries are to be encountered.

The most common form of seismic reflection is termed the Common Midpoint method (CMP). The aim here is to obtain a series of traces reflecting from the same midpoint. These traces are then stacked. Before this, however, a correction for time delay is essential, which is termed Normal Moveout. The different reflection points of the traces are corrected here in such a way that they appear in the stack section at the right time and in the correct position.

Common Midpoint method: Accurate pressure measurement is essential

In the practice of oil prospecting, a specially equipped vessel is used, which drags numerous measuring cables behind it, in this case named streamers, which can be several kilometers long. These streamers are equipped at regular intervals with hydrophones for recording the reflected waves. To generate those waves, a sound source is installed at the beginning of the streamer. In order to obtain the most accurate results, an awareness of the exact position (depth) of the hydrophones is essential. For this purpose, each individual hydrophone is equipped with a pressure measuring cell.

In oil prospecting below the seabed, the positioning of the hydrophones is often performed by pressure measuring cells made by STS. Since absolute precision is required in this complex and computationally intensive process, the measuring technology employed must meet stringent requirements. Because the streamers run only a few meters below the water surface, the measuring cells must be capable of displaying pressures from 0 to 15 bar. But because of their proximity to the water surface, the actual measuring range only goes up to 2 bar (absolute). The required accuracy in this particular range amounts to less than 0.3 percent total error.

Further requirements that STS has fulfilled in the development of these measuring cells according to customer requirements were, firstly, the small dimensions of 12 mm x 13.8 mm. Additionally, when the ship comes to a standstill, the hydrophones sink down. To withstand the pressures at a great depth and to remain further functional, the measuring cells must also withstand an overload pressure of 100 bar. And since this is a salt water application, titanium is used for the housing of the pressure measuring cell.

Leak integrity implies safety: Pressure measurement of pipelines

Leak integrity implies safety: Pressure measurement of pipelines

Below our feet is a vast, branch-like infrastructure without which commerce and society would cease to function. Millions of kilometers of pipelines transport natural gas, biogas and fresh and waste water from producers to consumers. Especially for those more hazardous materials like gas, safety plays an enormous role. Resource losses and environmental pollution can equally also result from leaking pipes. UNION Instruments has now developed a pressure test kit, which will henceforth simplify leak testing many times over. Pressure measurement cells made by STS are also employed in this kit.

The pressure test kit, PMS3000, from UNION Instruments GmbH was developed for implementing all essential process steps in the leak testing of pipelines consistently, by employing the matched components of a single testing system.

The fields of application are diverse:

  • gas supply according to DVGW G469-(A) A2, B2, B3, C3 and D2
  • potable water supply according to DVGW W400-2, Part 16
  • technology, industry, process technology
  • district heating pipelines
  • geothermal sensors
  • cable conduits
  • sewer pipes

Figure 1: Pressure test kit PMS3000 (Source: UNION Instruments)

At this point, we would like to concentrate on the leak testing of potable water pipelines by the so-called contraction process (also termed ‘contraction pressure testing’). The test medium in this instance will be water.

The contraction process in potable water supply

Potable water supply is often performed with plastic piping. If a high test pressure is applied, this will result in a volume increase. This expansion in turn causes a pressure drop, which makes leak testing more difficult. Additionally, it must be ensured that the pipeline to be tested is sufficiently air-free. The specialist contraction procedure ensures that a correct leakage assessment can be given here. The norms for this are set out in DVGW Worksheet W400-2, Part 16.

To perform the contraction process according to W400-2, Part 16, besides the PMS3000 pressure test kit, the DAK2000 pressure relief kit is also needed, so that the water volume to be discharged can be centrally recorded independent of the output volume and then relayed to the PMS3000. It is through this direct linking that manual exertion can be reduced and transmission errors avoided. To build up pressure, a pump is additionally essential. In this respect also, UNION Instruments has various solutions available which are matched to the PMS3000.

Figure 2:  Contraction process according to W400-2, Part 16
Source: UNION instruments

The contraction process (see Fig. 2) is relatively complex and takes place over several phases. The leak test itself extends over 3 to 4 hours. Using the PMS3000, the process is divided into seven phases. In the first phase, the relaxation phase, the static water pressure and pipe temperatures are measured. Next begins the pressure build-up phase. Here the test pressure is reached, which is about 4 bar higher than the operating pressure. This phase is completed within ten minutes. The rate of pressure rise can be observed with the PMS3000, thus allowing an initial evaluation of air-absence.

Once the test pressure is attained, the pressure maintenance phase then begins. Pressure preservation is achieved here by continuous re-pumping. In the following rest phase, the fall of pressure and thus the pressure reduction as a percentage of the test pressure is observed: The pressure here may not fall by more than 20 percent.

Next comes pressure reduction for testing air-absence. Water is released here, whose flow volume is measured and relayed to the PMS3000. This discharged water volume should be accompanied by a certain pressure fall. Should this not be the case, then too much air was present in the pipeline tested.

Once this phase is over, the 30-minute main test can begin. At this point, pressure is once again applied to the pipe. Should a fall in pressure occur here, then the main test will be extended to 90 minutes. Over this timeframe, the pressure in the pipe may not decline by more than 0.25 bar, otherwise the pipe would be deemed leaky.

This entire test process is stored on the SD card of the pressure test kit and is available as a PDF report requiring no further evaluation software from the user.

For its pressure measurements, the PMS3000 is equipped with a piezoresistive pressure transducer from STS. Since this pressure test kit is used in various applications, the demands upon these measuring cells are very high. They must be able to display a pressure range from just a few mbar up to 1,000 bar (leak testing hydraulic systems, for example) and yet still perform highly precisely. Among the requirements set out by UNION Instruments for STS was a stability of 5 mbar over ambient air temperature changes of 15 kelvin at test pressures ranging from 20 to 25 bar. For more on the integration of piezoresistive measuring cells into existing applications, please see here.

Characteristics of the PMS3000 system in brief:

  • robust, waterproof and on-site-ready pressure test kit
  • integrated report printer
  • colored-graphics touch display
  • 32 GB SD memory card, mobile readable over USB
  • various external connectors
  • test procedures of DVGW guidelines G469 (A) : 2010 and W400-2 : 2004 stored in-device
  • complete array of connection components and test pumps for pressure build-up available
  • integrated piezoresistive transducer from STS with a pressure range of 100 mbar to 1,000 bar (accuracy: ≤ ± 0.50 / 0.25 % FS)
Assured leak testing by relative and absolute pressure methods

Assured leak testing by relative and absolute pressure methods

Leakages can have fatal consequences. To efficiently design production processes and to prevent costly and image-tarnishing recalls, components need to be tested early within the manufacturing process. Leak testing, for this reason, plays an important role in quality management.

The verification of seal integrity and the detection of leakages is an integral element of quality assurance across various sectors. Additionally, an early recognition of faulty parts during the manufacturing process can avoid unnecessary costs. Areas of application here include the testing of individual components, as well as complete systems either in serial production or within a laboratory environment. The sectors in question range from the auto industry (cylinder heads, transmissions, valves etc.) and medical engineering, right through to the plastics, packaging and cosmetics industries.

The German company ZELTWANGER Dichtheits- und Funktionsprüfsysteme GmbH is one of the most distinguished manufacturers of high-performance leakage testers. Depending upon the specific application, a range of leak testing procedures are optional, including the relative and absolute pressure methods.

Leak testing by the relative and absolute pressure methods

The relative or absolute pressure processes deliver the following decisive advantages:

  • compact test setup of small tare volume
  • high operating safety
  • extended measurement range
  • automation optional

During these procedures, the test item is subjected to a defined pressure. To be measured and analyzed over a set time is the pressure differential resulting from a leakage. In the relative pressure method, the difference to ambient pressure is decisive. When the test pressure is higher than ambient pressure, then we speak of overpressure testing. The terms negative pressure or vacuum testing then apply when test pressures register lower than ambient pressure. By the absolute pressure method, the pressure is determined relative to absolute vacuum.

When leak testing by either the relative or absolute procedures, ZELTWANGER also employs pressure measurement cells made by STS. The demands upon the technologies applied are rigorous, essential being:

  • outstanding signal processing
  • flexible pressure ranges
  • varying measurement methods (differential, relative and absolute pressures)
  • outstanding reliability

The ATM pressure sensor from STS meets these required specifications with its broad pressure range of 100 mbar to 1,000 bar and an accuracy of ≤ ± 0.10 %FS. But apart from these figures, its fail-safe ability and extremely good signal processing also represent crucial features. The modularity of STS sensors even offer manufacturers the option of straight forwardly integrating them for their own internal applications.

STS pressure transmitters, along with self-developed sensors from ZELTWANGER, are already integral to devices of the ZED series. These excel for both their versatility and precision. The ZEDbase+ device reliably measures, for example, relative, and differential pressures, as well as mass flow. Recorded test pressures, depending upon testing method, have ranged from vacuum to 16 bar. With relative pressure, even the slightest of pressure shifts from 0.5 Pa to 4 Pa can be detected. Besides these technical requisites, further decisive arguments in favor of STS are a reliable supply status, coupled with flexible and uncomplicated customer support – not to mention a major common ground between both of the companies involved. Our collective aim is always to provide customers with tailored solutions which exactly fulfill their exacting specifications.

Could a high-pressure direct-injection hydrogen engine replace the turbodiesel?

Could a high-pressure direct-injection hydrogen engine replace the turbodiesel?

Having fallen from grace, the once iconic diesel power unit appears to have run its course. Even cities, such as Paris, that once incentivized the use of diesel are now calling for OEMs to stop production by 2025. Although this is highly unlikely to happen, it is an expression of the world’s concerns over global warming and air pollution in general.

To meet ever tightening emissions regulations OEMs are studying new and often untried forms of propulsion: Everything from full electrification to hybrids and even hydrogen fuel cells are being tested as possible solutions.

Hydrogen in particular is piquing the interest of researchers around the world – it’s hailed as a clean burning fuel that could very well end up powering the transport of the future.

The difference between hydrogen and conventional hydrocarbons lies in its wide stoichiometric range from 4 to 75 percent by volume hydrogen to air, and under ideal conditions the burning velocity of hydrogen can reach some hundred meters per second. These characteristics make it highly efficient when burning lean mixtures with low NOx emissions.

Forty years of hydrogen injection

Hydrogen injection has been around since the 1970s and works by injecting hydrogen into a modified, internal combustion engine, which allows the engine to burn cleaner with more power and lower emissions.

Earlier low pressure systems, which are still in use today, injected the hydrogen into the air prior to entering the combustion chamber. But with hydrogen burning 10 times faster than diesel and, once mixed with the diesel in the combustion chamber, increasing the burn rate several problems have been experienced. The most significant being:

  • Light-back of the gas in the manifold
  • Preignition and/or autoignition.

The best way to overcome these problems is to fit a high-pressure direct injection system that provides fuel injection late in the compression stroke.

Optimizing the combustion process through accurate pressure measurement

In order to do this the injection needs to be accurately mapped to the engine. This can only be accomplished through gathering test data regarding temperature (manifold, EGT and coolant), pressure (cylinder/ boost, line and injector), the turbulence in the manifold and combustion chamber, and the gas composition.

The mixture formation, the ignition and the burning processes are commonly studied through two different sets of experiments. The aim of the first experiment is to obtain information about the highly transient concentration and distribution of hydrogen during the injection process.

During this test a Laser-Induced Fluorescence (LIF) on tracer molecules is used as the primary measurement technique to study the behavior of the hydrogen under compression and ignition. Using a constant volume combustion chamber (CVCC) with the same dimensions as the actual C.I. engine, implying that the volume in the CVCC equals the volume in the cylinder at the top dead center, pressurized hydrogen is injected into the cold pressurized air through a hydraulically controlled needle valve.

Using high quality pressure sensors, the effect of various injection pressures on the combustion process can be studied. By observing the behavior and volume of unburned gas, the time taken to optimize the injection pressure for a specific number and position of injector nozzle holes and also the injection direction is drastically reduced.

And using unique software the ignition delay, which is dependent on the temperature and the concentration of hydrogen in air at a given pressure can be determined. Once again, it’s important that the pressure readings are accurately recorded, across a range of pressures that vary between 10 to 30 MPa.

Furthermore, this method allows for the definition of areas of the injection jet where self-ignition conditions exist, which is useful for the development of an optimized injection system for engines to be converted from diesel fuel to hydrogen.

In recent tests carried out by a premium brand OEM,the optimized high pressure hydrogen injected engine showed a promising increase in specific power while reducing fuel consumption and achieving 42% efficiency – values that match the best turbodiesel engines.

Based on the findings it would certainly appear as if work carried out on optimizing the pressure of these 30 MPa systems may in fact offer another source of clean energy for future transport.

Subscribe To Our Newsletter

Join our mailing list to receive the latest news and updates from our team.

You have Successfully Subscribed!